
Click Here if you don't see topics listed to the left and below.

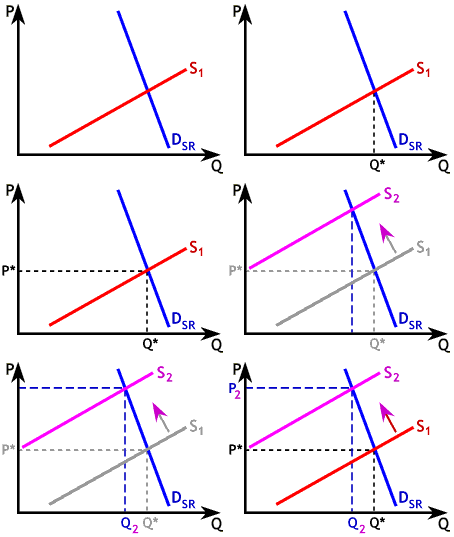
The graph to the right shows a reduction in supply from S1 to S2. At first, in the short-run the operative demand curve is DSR. As we have learned, both demand and supply can become more elastic over time. In the short run the reduction is supply leads to a large increase in price (from P* to P2), and a modest drop in quantity (from Q* to Q2).
What happens in the long run?


Click Here if you don't see topics listed to the left and below.