
Click Here if you don't see topics listed to the left and below.

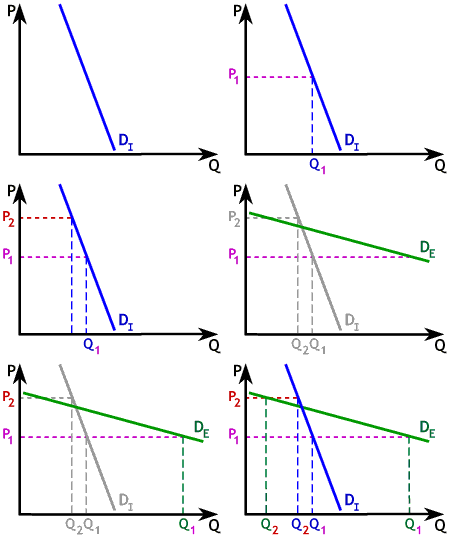
In the graph to the right, DI is drawn very steep, to illustrate inelastic demand; while DE is drawn flatter, to illustrate elastic demand. Notice the effect of a shift from P1 to P2 in each case.
Along DI quantity demanded drops slightly, from Q1 to Q2, consistent with inelastic demand. Along DE the effect of a price change is much more pronounced. Quantity
drops from Q1 to Q2, a huge drop, and what we expect from very elastic demand.


Click Here if you don't see topics listed to the left and below.