
Click Here if you don't see topics listed to the left and below.

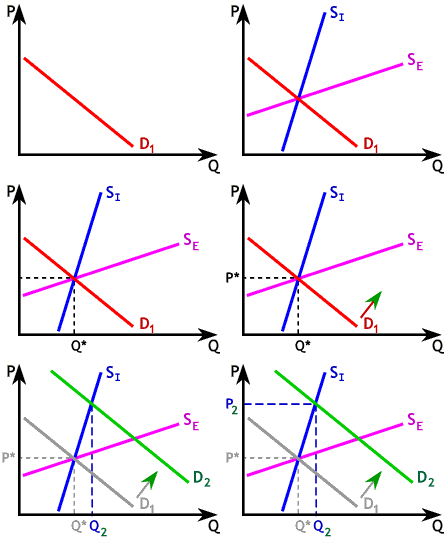
To the right is a graph showing a demand shift for two different types of supply curves; SI, a curve for an inelastically supplied good and SE, a relatively elastic supply curve.
Starting from the initial equilibrium price P* and quantity Q* with a demand shift from D1 to D2, at supply SI the price increases to P2 and the quantity increased to Q2; a large increase in price and a modest increase in quantity.


Click Here if you don't see topics listed to the left and below.