
7 As with the other graphs, don't worry about the meaning of marginal cost at this point. Marginal Cost curves will be covered in detail in Chapter 5.
Click Here if you don't see topics listed to the left and below.

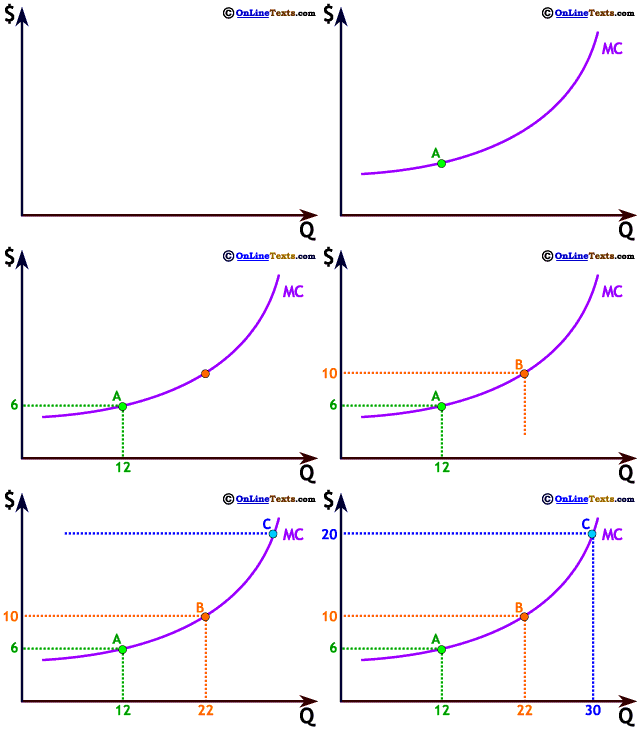
To the right we show a positive nonlinear relationship. It is a positive relationship because higher Quantities, Q, are associated with higher Costs, $. Since the graph of this relationship is a curve, it is termed nonlinear. This particular graph is the upward sloping portion of a Marginal Cost, MC, curve.7
In this case, the graph to the right shows a relationship that is increasing at an increasing rate. As Quantity increases, cost increases at a faster rate. When Q increases from 12 to 22, an increase of 10 units, $ only increases from 6 to 10, or 4 units. However, when Q increases from 22 to 30, an increase of only 8, $ increases from 10 to 20, or an increase of 10 units. A relationship such as this is said to be increasing at an increasing rate.


7 As with the other graphs, don't worry about the meaning of marginal cost at this point. Marginal Cost curves will be covered in detail in Chapter 5.
Click Here if you don't see topics listed to the left and below.