|
Chapter Thirteen: Lecture Notes -- Budget Deficits and the National Debt
|
The budget deficit is the amount by which the federal government's outlays exceed its revenue in a given year. The national debt is the federal government's total indebtedness at a moment in time. |
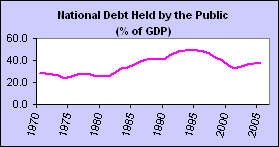
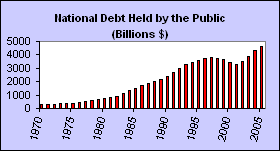
The Budget Deficit vs. the National DebtNote: Large images are available for viewing by clicking on the smaller images on this page.A budget deficit is the amount by which the federal government's outlays exceed its revenue in a given year. If, for example, the government collects $700 in tax revenue in the year but spends $900, the budget deficit is $200. (Correspondingly, the budget surplus is -$200.) The national debt is the federal government's total indebtedness at a moment in time. It results primarily from previous deficits. The difference between the budget deficit and the national debt is the difference between a flow (something measured over a period of time) and a stock (something measured at a point in time). A good analogy is to think of water filling into a swim pool. The rate at which the water is pouring out of the spicket filling up the pool is comparable with the budget deficit. The total amount of water in the pool at any point in time is comparable with the national debt. Deficits accumulate over a period of time (we typically describe deficits on a yearly basis) but the debt can be measured at any given second. Note that if the spicket pours water into the pool at a faster rate, the level of water in the pool rises more quickly. Just how much debt does the U.S. government have? As of August, 2006, the total national debt was $8.4 trillion. This amounts to $28,000 for each of the approximately 300 million persons living in the U.S. The U.S. Treasury Department maintains statistics on the Debt to the Penny. As we discuss below, much of the debt is held by the government itself; the debt held by the public--shown in the figure titled National Debt Held by the Public--was $4.6 trillion at year-end 2005.
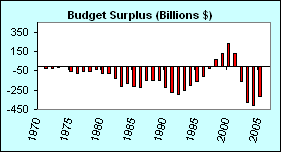
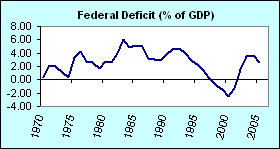
Budget deficits increased significantly in the mid-1980s and peaked in the early 1990s, as illustrated in the figure titled Budget Surplus. Economists blame several factors for the increased deficits of the 1980s. First, outlays for government entitlement programs, especially Social Security and Medicare, surged in the 1980s. Second, the productivity growth rate of the economy slowed somewhat inexplicably after 1973 (see Chapter 18, Economic Growth and Productivity), reducing the growth of the nation's tax base. Third, President Reagan simultaneously passed tax cuts and increased significantly expenditures for defense. Congress rejected most of the planned non-defense budget cuts that Reagan proposed. The combination of higher spending and lower tax revenues led to higher budget deficits. The deficits of the early 1990s were compounded by the recession of 1990-91. Not until 1993 did deficits begin to shrink. Because of the strong U.S. economy in the latter half of the 1990s, budget deficits shrunk rapidly. In fact, the U.S. ran surpluses between 1998 and 2001. The surplus topped $236 billion in 2000 and $128 billion in 2001. In 2002 the more typical deficit pattern emerged again. The $378 billion deficit in 2003 and the $413 billion deficit in 2004 are partly due to the recession in 2001, the stock market decline, tax cuts enacted under President Bush, and increased government spending to combat terrorism and invade Iraq. The 2004 budget deficit of $413 billion is in nominal terms the largest deficit in U.S. history, although as we explain below, deficits relative to the size of U.S. income were larger in the 1980s.
|
Most of the U.S. national debt is owned by U.S. citizens, corporations, foreigners and the government itself. |
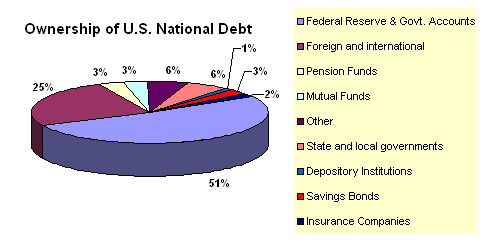
To Whom Does the Government Owe the Debt?At year-end 2005--the government's fiscal year ends September 30--the U.S. federal government was about $8.2 trillion in debt. To whom does it owe the money? As it turns out, most of the debt is owed to domestic corporations, individual citizens, foreign investors, and the government itself. The figure titled Ownership of U.S. National Debt breaks down ownership of the debt by entity as of year-end 2005. The Federal government and the Federal Reserve are by far the biggest owners of the debt, accounting for 51 percent of the total. Foreigners own another 25 percent, followed by state and local governments, pension funds, and mutual funds. Savings bonds purchased by individuals account for a small fraction of the debt--just 3 percent.
The idea that the government owns some of its own debt seems odd at first. The mystery is cleared up by considering that some government accounts are in surplus while others are in deficit. Social security revenues, for example, currently exceed Social Security expenditures. The surpluses, however, do not sit in the so-called "lock-box;" they go into the general revenue fund, which the government spends for other programs like education and defense. The government spends this Social Security money by issuing government bonds that the Social Security Trust Fund purchases. Thus, the Social Security surplus is actually a pile of Treasury bonds. To clarify this concept further, imagine that you and your sister each have a checking account. Your checking account balance is -$100 while your sister's account has a balance of $300. The "family" checking account balance is $200. To avoid bounced check fees, you write an IOU of $100 to your sister and she lends you the $100 to deposit in your account. After the loan, your checking account now has a zero balance and your sister's account has a $200 balance, giving the same net family balance of $200. However, you also have $100 in debt. Intra-governmental borrowing essentially works the same way.
|
The absolute size of the U.S. national debt is less important than the size of the debt relative to the size of the economy. |
Why the Debt and/or Deficit Burden May be OverstatedMany times the press presents alarming news of the national debt. We hear how our children are born into massive debt, and how if we pile the debt up in $1 bills, it would stretch far into the skies. Indeed, the debt is large in absolute numbers. But there are several reasons to believe that concerns about the debt and deficit are overstated.
|
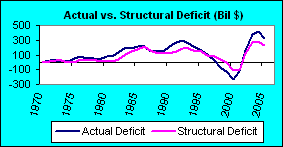
The budget deficit can be divided into two components: the structural deficit and the cyclical deficit. |
Structural vs. Cyclical Components of the DeficitEconomic conditions play a vital role in determining the government's budget position. When an economy goes into recession, the budget deficit rises. This increase occurs for two reasons. First, a recession means that GDP and, hence, aggregate income are falling, which reduces tax revenue. Second, government outlays rise during recessions. Demand for welfare, food stamps, public health care, and other transfer programs increases as incomes fall. The combined effect of spending increases and falling tax revenues increases the budget deficit. To account for the business cycle effects on the budget deficit, we can decompose the total deficit into two components. The structural deficit is the deficit that the government would have if the economy were at potential output. On the other hand, the cyclical deficit is the portion of the deficit attributable to the business cycle. The two parts sum to equal the total deficit, or
In general, economists agree that cyclical deficits are good for the economy. Cyclical deficits help to stabilize the business cycle. Imagine if the federal government reduced expenditures when the economy went into recession to balance the budget! This action (which state and local governments are required to do) would amplify the recession and magnify the economic hardships that people experience during downturns in the business cycle. Fortunately, the federal government need not balance its budget every year. It is the structural (or cyclically adjusted) portion of the deficit that gives concern to most economists. As the figure titled Actual vs. Structural Deficit shows, structural deficits were quite high between 1983 and 1995, but they declined quickly and turned to surpluses in 1999. Since then, the structural deficit has risen very quickly to exceed the levels of the early 1990s. Note that the vertical distance between the lines in the figure reflects the cyclical deficit. Total deficits exceed structural deficits when there is a cyclical deficit and the economy has an unemployment rate above the natural rate of unemployment. This scenario existed in the early 1980s and again in the early 1990s as the economy suffered through recession years. Between 1996 and 2001, however, the structural deficit was less than the total deficit, reflecting an unemployment rate below the natural rate. In other words, the cyclical deficit was negative (there was a cyclical surplus). With the recession of 2001, the cyclical deficit returned.
|
The thought that large deficits today impose a net burden on future generations is largely a myth. Because most of the debt is owned by U.S. entities, if future generations pay more in taxes to service the debt, they will also receive a substantial portion of the higher debt payments. |
Myths about the Deficit and DebtWe have yet to ask the question, why are large structural deficits and the correspondingly large debts bad? Better yet, are they harmful at all? Before we answer these questions, let's dispel some common myths about U.S. deficits.
|
Perhaps the largest cost of the deficit is the crowding out of private investment, which occurs when the public sector competes for loanable funds with the private sector. The resulting higher interest rates slow private investment. Large budget deficits can lead to large trade deficits, a scenario known as the twin deficit problem. |
True Costs of the DeficitDespite the heated debates regarding large deficits and debts, most people have a difficult time expressing exactly why they are harmful. Having discussed what is not true about large deficits, let's discuss what the potentially harmful effects are.
|
Recent budget surpluses have eased concerns about harmful effects from budget deficits. Looming demographic and health care costs, however, combined with an economic slowdown could result in large deficits once again. |
Overall Assessment of the Current Federal Budget SituationThe general consensus of economists on the current state of U.S. deficits and debt may be summed up as follows. Is there an impending crisis? No, if by crisis we mean that today's deficits unduly harm prospects for future economic growth. Could there be a crisis in the future? Possibly. The large deficits incurred in the mid- to late-1980s were harmful to the extent that they crowded out private investment and replaced that investment with consumption spending. However, there is disagreement over how large the crowding-out effect was and whether or not crowding out even occurred at all. The more accepted--but still controversial--story is that the large deficits of the 1980s led to a strong U.S. dollar, which reduced net exports (see Chapter 7, Foreign Exchange and the Balance of Payments) and led to the twin deficit problem.The recent surpluses notwithstanding, the terrorist attacks of September 11, 2001 and the recession in that year quickly turned the surpluses into a significant deficit. The $318 billion deficit in 2005 stands in stark contrast to the surpluses recorded just a few years ago. In addition, the looming demographic and health care issues will strain the federal budget even more. As the U.S. population ages, Social Security and Medicare payments will increase. Given those structural pressures and a business cycle contraction, the government could find itself in an unpleasant budget situation in the not-so-distant future. Ultimately, the condition of the federal budget depends on the strength of the U.S. economy. If the economy grows at a strong pace over time, the government's tax base rises quickly, alleviating budget pressures.
Useful Web Resources
|
Copyright © 1996-2006 OnlineTexts.com - All Rights Reserved |