
Chapter Seven: Foreign Exchange and the Balance of Payments
- Foreign Exchange and Exchange Rates
- Determination of the Exchange Rate
- Exports, Imports and Trade Deficits
- International Capital Flows
- The Balance of Payments
- Useful Web Resources
Foreign Exchange and Exchange Rates
During the year 2005, U.S. citizens purchased nearly $2.0 trillion in imports; consequently, U.S. citizens--mostly without realizing it--demanded nearly US$2.0 trillion in foreign exchange. Foreign exchange is currency and bank deposits that are denominated in foreign money. Consumers indirectly deal in the foreign exchange market every time they purchase an import. Suppose that a U.S. consumer purchases an imported Toyota for US$30,000 from a domestic automobile dealer. The automobile was produced in Japan and shipped to the U.S. dealer, with the US$30,000 payable upon the sale of the vehicle. The consumer pays US$30,000 to the automobile dealer who in turn goes to a bank and purchases US$30,000 worth of yen. If one U.S. dollar purchased 100 yen, US$30,000 would purchase 3,000,000 yen (30,000 x 100). The U.S. automobile dealer then pays the Japanese automobile producer 3,000,000 yen and the transaction is settled. Of course, this example ignores real world complexities such as wholesalers and shipping costs; nevertheless, consumer demand for an import is simultaneously a demand for foreign exchange.The exchange rate (e) is the amount of domestic currency that it takes to purchase one unit of foreign currency. We will view everything from the U.S. perspective. For example, if US$1 purchases 5 pesos, then it takes US$0.20 to purchase 1 peso, so the exchange rate is 0.2 or 1/5. Alternatively, if US$1 purchases 0.50 pounds, then it takes US$2 to purchase one pound so the exchange rate is 2.0. Confused?
| TABLE 1 Exchange Rates |
|||
| Country | Currency | U.S.$ Equivalent | Currency per U.S. $ |
| Brazil | Real | 0.369 | 2.71 |
| Britain | Pound | 1.87 | 0.535 |
| Canada | Dollar | 0.812 | 1.23 |
| E.M.U. | Euro | 1.30 | 0.766 |
| India | Rupee | 0.023 | 43.76 |
| Japan | Yen | 0.010 | 104.84 |
| Mexico | Peso | 0.089 | 11.28 |
| Taiwan | Dollar | 0.031 | 32.01 |
| Note: Many exchange listings use the Currency per U.S. $ method except when quoting the British pound. The British pound is almost always quoted as the U.S. $ Equivalent. | |||
To confuse things even more, exchange rates are often quoted as the inverse of the above definition. A table of exchange rates can be read daily from any major newspaper such as the
New York Times or the
Wall Street Journal.
The Board of Governors of the Federal Reserve also posts comprehensive exchange rate data on a weekly and monthly basis. Table 1 lists exchange rates as would be seen in many business newspapers as of January 7, 2005. Notice that exchange rates are defined two ways, either as the U.S. $ Equivalent, or Currency per U.S. $. The U.S. $ Equivalent tells us how much one unit of foreign currency is worth in U.S. dollars while the Currency per U.S. $ quotes foreign currency in terms of how much foreign currency one U.S. dollar can purchase. For example, for the U.S.-euro exchange rate, the U.S. $ Equivalent is 1.30, meaning that it takes about US$1.30 to purchase one euro. Conversely, the Currency per US $ is 0.766, such that one U.S. dollar can purchase about 0.77 euros. The way we define exchange rates in this chapter is the U.S. $ Equivalent.
Changes in exchange rates
As with the prices of all commodities, the prices of currencies change over time. In fact, currencies are traded continuously much like stocks so that exchange rates fluctuate minute by minute. Suppose initially that one U.S. dollar equals one Argentine peso, or e = 1.0. The U.S. dollar then appreciates--becomes stronger--relative to the peso so that one U.S. dollar purchases 1.25 pesos, or 1 peso costs US$0.80. The exchange rate declines from 1.0 to 0.80. This example leads to the following general relationship: An appreciation of the domestic currency corresponds with a decrease in the exchange rate. The converse is also true: A depreciation of the domestic currency corresponds with an increase in the exchange rate. To illustrate, let us assume once again that one U.S. dollar equals one Argentine peso. If the U.S. dollar depreciates (weakens) such that it now takes US$1.25 to purchase one peso, then the exchange rate rises to 1.25.
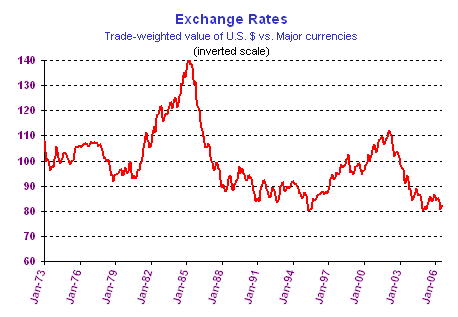
U.S. exchange rates have fluctuated widely over time. The figure titled "Exchange Rates" plots the average value of the inverse of the U.S. exchange rate against the currencies of its major trading partners between 1980 and 2006. Because of the inverse scaling, rising values indicate a stronger U.S. dollar. Notice the strong U.S. dollar in the mid-1980s. As we explain below, the mid-1980s was a period when U.S. exporters had a difficult time competing in international markets and U.S. consumers enjoyed cheap prices of imports. The dollar rose again in the mid- to late 1990s as foreigners rushed to invest their wealth in U.S. assets to take part in the booming economy. The dollar began to slide in 2002 and continued its slide through 2004.
Determination of the Exchange Rate
When a nation's currency is allowed to trade openly in world markets, the forces of supply and demand interact to determine the exchange rate (See Chapter 3, Supply and Demand). Currency is supplied and demanded, and the equilibrium price of the currency is the exchange rate.Demand for Foreign Exchange
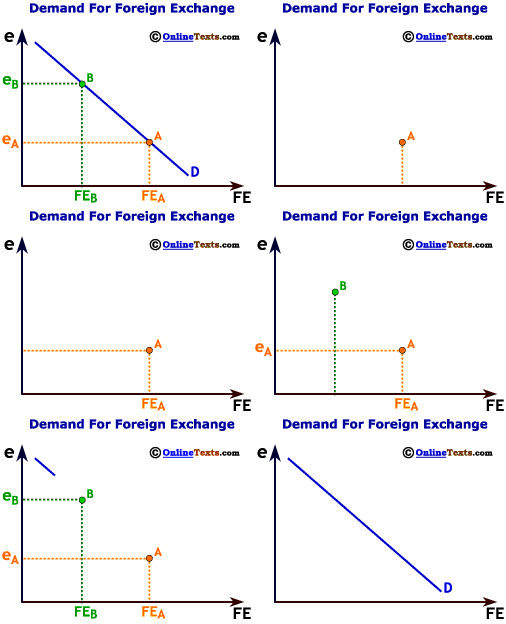
Demand for foreign exchange is domestic demand for foreign currency. As described above, import demand is simultaneously a demand for foreign exchange. The figure titled "Demand for Foreign Exchange" plots the exchange rate on the vertical axis against the quantity of foreign exchange on the horizontal axis.
Given the exchange rate eA, the quantity demanded of foreign exchange is FEA. As the exchange rate rises to eB, the quantity demanded of foreign exchange falls to FEB. Therefore, the demand curve for foreign exchange is negatively sloped; as the exchange rate rises, quantity demanded of foreign exchange falls.
The reasoning for the negative slope of the demand curve is the following. Suppose that one U.S. dollar initially purchases one euro such that e=1. Simplifying, a flashlight that costs 10 euros to produce in Germany will sell for US$10 in the U.S. Now the U.S. dollar depreciates or weakens relative to the euro such that the exchange rate, e, rises to 1.5. At this exchange rate, it takes US$1.50 to purchase 1 euro. The same flashlight that costs 10 euros to produce in Germany will sell for US$15 in the U.S. Because the U.S. dollar weakened relative to the euro, it takes more U.S. dollars to purchase the same amount of euros; consequently, the prices of imports rise. When import prices rise, demand for imports fall and, hence, the demand for foreign exchange falls.
Supply of Foreign Exchange
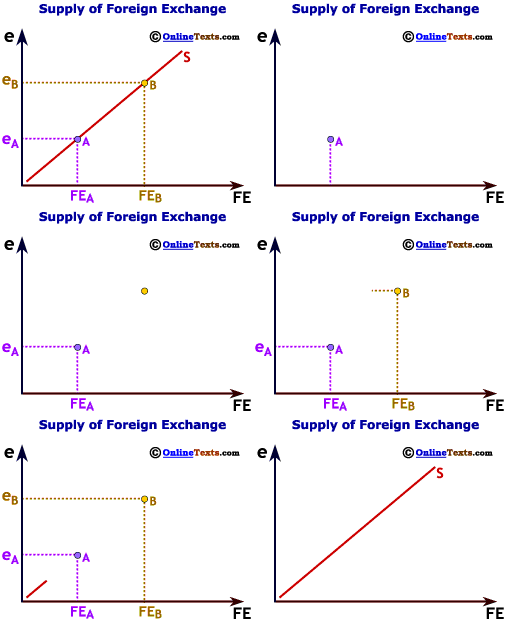
The opposite side of the coin is the supply of foreign exchange. The U.S. supplies foreign exchange when it makes the U.S. dollar available for purchase by a foreign entity. For example, suppose that someone from Mexico wishes to purchase a Chevy Blazer produced in Detroit, Michigan. The Mexican citizen purchases the Blazer from the Mexican automobile dealer and pays in pesos. The Mexican dealer then exchanges pesos for U.S. dollars and pays the automobile producer in U.S. dollars. In this example, the U.S. supplied dollars to Mexico. Just as the demand for foreign exchange comes from imports, the supply of foreign exchange comes from exports.
Given the exchange rate eA in the figure titled "Supply of Foreign Exchange", the quantity supplied of foreign exchange is FEA. As the exchange rate rises to eB, the quantity supplied of foreign exchange rises to FEB. Therefore, the supply curve for foreign exchange is positively sloped; as the exchange rate rises supply of foreign exchange also rises.
Again, let us assume that one U.S. dollar purchases one euro, so e=1. A flashlight that costs US$10 to produce in the U.S. sells for 10 euros in Germany. Now the exchange rate rises (remember, always from the U.S. perspective) to 1.5 so that one euro can purchase US$1.50. With the higher exchange rate, it takes just 6.67 (10/1.5) euros to purchase the US$10 flashlight. Instead of selling for 10 euros, the flashlight sells for just 6.67 euros. With U.S. export prices cheaper in Germany, Germany's demand for U.S. exports will rise; therefore, the U.S. supply of foreign exchange will rise.
The Equilibrium Exchange Rate
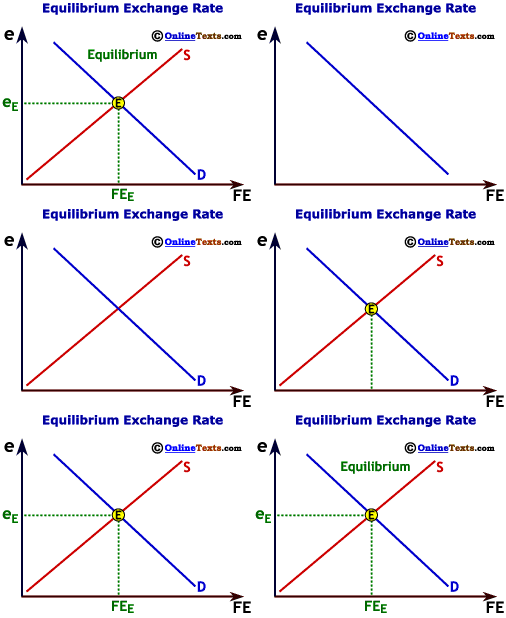 The forces of supply and demand interact to determine the exchange rate. The figure titled "Equilibrium Exchange Rate" illustrates equilibrium at point E in the foreign exchange market. At this equilibrium, the exchange rate is EE and the quantity of foreign exchange is FEE.
As with other goods, factors that influence the supply or demand for foreign exchange can change, which will affect the equilibrium outcome. We deal with one of these forces below.
Exports, Imports and Trade Deficits
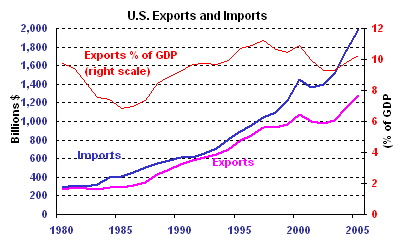 International trade has surged in recent years. Advances in technology have led to improvements in communications, information flows and transportation, allowing people from distant locations to trade relatively easily. In 2005 the United States exported US$1.28 trillion in goods and services, up from just US$272 billion in 1980. Simultaneously, imports of goods and services were US$2.0 trillion in 2005, up from US$291 billion 1980. Time series of nominal U.S. imports and exports are plotted in the figure titled "U.S. Exports and Imports."
As large as these trade numbers are, they must be put into context. The U.S. nominal GDP in 2005 was approximately US$12.5 trillion; therefore, the ratio of exports to GDP (also charted in the figure) was just 10.2 percent. In other words, despite the enormous absolute size of the country's trade, most of the production in the U.S. is for domestic consumption.
| TABLE 2 U.S. Trade Deficits | |
|---|---|
| Year | Trade Deficit (US$ Billions) |
| 1980 | 19.4 |
| 1985 | 121.9 |
| 1990 | 80.9 |
| 1995 | 96.3 |
| 2000 | 377.6 |
| 2003 | 494.9 |
| 2004 | 611.3 |
| 2005 | 716.7 |
Each year since 1980, the U.S. has imported more goods and services than it has exported. The excess of imports over exports is referred to as the trade deficit or the (negative) balance on goods and services. The Census Bureau reports the U.S. trade deficit on a monthly basis. Table 2 lists U.S. trade deficits for selected years. Trade deficits have increased substantially over the last few years because of the strong growth of the U.S. economy combined with a strong dollar. When American incomes rise relative to incomes of foreigners, purchases of imports increase as well, leading to the larger deficit. In 2005 the trade deficit was US$716.7 billion, nearly double the 2000 deficit.
Trade deficits suggest that the demand for foreign exchange exceeds the supply of foreign exchange. If the U.S. demands US$2.0 trillion in foreign exchange to purchase imports but it supplies just US$1.3 trillion to provide exports, does that not imply that the market is in disequilibrium? If imports and exports were the only reasons that we traded foreign exchange then the market would be in disequilibrium and the exchange rate would rise (the U.S. dollar would depreciate) until supply and demand for foreign exchange were equal. Recall that a depreciating U.S. dollar increases import prices and decreases export prices. However, another source of supply and demand for foreign exchange exists that potentially allows trade deficits or surpluses to persist year after year.
International Capital Flows
Besides imports, another source of demand for foreign currency comes from investing in foreign assets. A capital outflow is the purchase of a foreign asset by a domestic entity. For example, many U.S. employers offer savings plans to employees as part of their benefit package. Often, the employee has several choices of how to invest the savings, including an international equity account. In essence, the employer hires a fund manager to pool the funds from the employee savings plan and invest in foreign stocks. In this example, the employee who elects the international equity account is demanding foreign exchange. If the international equity fund purchases Japanese stocks then the U.S. dollars must be converted to yen before the stocks are purchased. Capital outflow may be more direct by way of foreign direct investment. If Coca-Cola Inc. builds a production plant in Singapore, then U.S. dollars must be converted to the Singapore currency to fund the plant.
A major reason that capital flows from one nation to another is to earn a higher interest rate return than the domestic return. For example, if a U.S. investor had US$10,000 to invest and she believed that U.S. stocks would yield 7 percent but British stocks would yield 9 percent, then she would likely purchase the British stocks. Capital outflows are typically high during a financial or national crisis as people protect their savings. When civil war was raging in Yugoslavia in the 1990s, for example, many people in Yugoslavia transferred their savings to the other European nations. Likewise, Russia experienced massive capital outflows at the beginning of its transition as people feared losing their savings to hyperinflation or government confiscation. Higher expected returns in other nations relative to the domestic nation increases capital outflows.
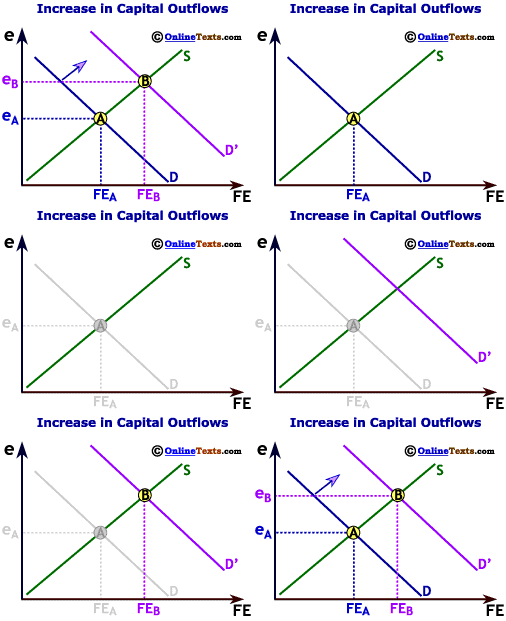
An increase in capital outflows simultaneously increases the demand for foreign exchange because the domestic investor must purchase the foreign currency while purchasing the foreign asset. As the figure titled "Increase in Capital Outflows" illustrates, an increase in capital outflows shifts the demand for foreign exchange to the right, increasing both the exchange rate and the quantity of foreign exchange traded in the market. Notice that because of the higher exchange rate and, hence, weaker U.S. dollar, imports decrease and exports increase relative to their levels before the change in the capital outflow.
Supply of foreign exchange is also affected by international capital flows. When foreigners decide to invest in U.S. assets, the U.S. economy receives a capital inflow. An example of a U.S. capital inflow is the purchase of a U.S. stock or bond by a Mexican citizen. The U.S. supplies foreign exchange (U.S. dollars) to the Mexican investor by swapping U.S. dollars for pesos. A capital inflow also occurs when a foreign firm purchases or builds assets in the U.S. For example, the Japanese purchase of the Seattle Mariners baseball team is a capital inflow.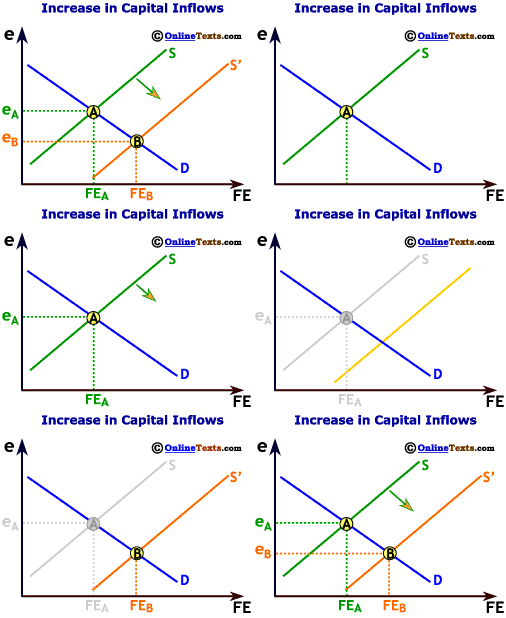 Capital inflows increase the supply of foreign exchange and make the domestic currency stronger. The figure titled "Increase in Capital Flows" illustrates the effect of capital inflows on the domestic economy. The supply curve shifts to the right, reducing the exchange rate from eA to eB. The quantity of foreign exchange also increases. Because of the stronger currency, imports increase and exports decrease relative to their levels before the change in the capital outflow
We can now explain the paradox of persistent trade deficits. If foreigners are willing to invest more funds in U.S. assets than U.S. citizens are willing to invest in foreign assets, then the U.S. can run a persistent trade deficit year after year. In other words, the U.S. may demand more foreign exchange for imports than it supplies for exports, but the difference is made up in international capital flows. The U.S. demands less foreign exchange for capital outflows than it supplies in foreign exchange for capital inflows. Ultimately, the supply and demand for foreign exchange are equal.
The Balance of Payments
The Balance of Payments is a record of a country's trade in goods, services, and financial assets with the rest of the world. It is the international accounting system that allows a country to keep track of foreign exchange flows. Entries into the balance of payments are either debits or credits. From the U.S. perspective, debits are items that represent demand for foreign exchange; these are items for which U.S. dollars flow out of the country. Credits are items that represent supply of foreign exchange, or items for which U.S. dollars flow into the country.The Balance of Payments is composed of two major accounts: the current and capital accounts. Due to the flexible exchange rate system, the value of the currency flowing out of the country equals the value of the currency flowing into the country. This implies that the current and capital accounts must sum to zero such that:
- Balance of Payments = Current Account + Capital Account = 0
- or, Current Account = - Capital Account.
Table 3 lists the 2005 U.S. balance of payments.
| TABLE 3 | |||
| U.S. Balance of Payments, 2005 | |||
| (Billion US$) | |||
| Debits | Credits | Balance | |
| Current Account | |||
| Exports | |||
| †††† Goods | 894.6 | ||
| †††† Services | 380.6 | ||
| †††† Income | 474.6 | ||
| Imports | |||
| †††† Goods | 1677.4 | ||
| †††† Services | 314.6 | ||
| †††† Income | 463.4 | ||
| Net Unilateral Transfers | 86.1 | ||
| Current Account Balance | -791.7 | ||
| Capital Account | |||
| †††† Capital Outflows | 426.8 | ||
| †††† Capital Inflows | 1212.3 | ||
| Capital Account Balance | 785.5 | ||
| Statistical Discrepancy | 6.2 | ||
Current Account
The current account primarily tracks the international flow of goods and services. Exports and imports dominate the current account. Because exports are items that bring U.S. dollars into the U.S., exports are entered as credits in the current account. Imports are entered as debits. Most of the U.S. trade deficit results from a deficit on goods. In the year 2005, the U.S. imported about US$783 billion more in goods than it exported. In contrast, the U.S. typically runs a services surplus. The surplus was about US$66 billion in 2005.The current account includes more than just exports and imports of goods and services. It also includes net income that U.S. citizens earn from abroad on their investments and net unilateral transfers. The net income on investments includes foreign stock dividends and interest payments on foreign-held bonds. Unilateral transfers are gifts and grants sent abroad by U.S. residents. In sum, the U.S. current account deficit in 2005 was US$785.5 billion, 91 percent of which was due to the US$717 billion trade deficit.
Capital Account
The capital account primarily tracks the international flow of financial assets. Capital inflows bring currency into the domestic country so they register as credits in the balance of payments. Capital outflows are debits. In 2005 the capital account surplus was US$785.5 billion, meaning that foreigners invested US$785 billion more in U.S. assets than U.S. entities invested in assets of foreign nations.
Statistical Discrepancy Account
Because the current and capital accounts must sum to zero in theory, but rarely do in practice, the statistical discrepancy account corrects for errors and omissions in the accounts to ensure that the balance of payments sums to zero. This component exists solely for accounting reasons. Suppose that someone in the U.S. sends US$1,000 in cash by mail to a family member in another country. The US$1,000 represents a unilateral transfer that is not recorded in the balance of payments. Alternatively, suppose that drug smugglers import US$1,000 in illicit drugs into the U.S. and the drugs are paid for with cash. The transaction should be recorded in the accounts as imports but they are not. In 2005 the absolute value of the capital account balance was smaller than the absolute value of the current account balance by US$6.2 billion. Therefore, the statistical discrepancy account was charged with a balance of US$6.2 billion.