
Economic growth is the increase in the total output of the economy, measured as the annual percentage change in real GDP.
Economic growth shifts the LRAS curve to the right.
The Rule of 69 is an easy way to estimate how many periods it will take for a number to double, given the annual growth rate.
Extensive growth is growth due to an increase in resource inputs.
Intensive growth is growth due to technological advancements.
Productivity is a measure of the ability of a resource to generate output.
Labor productivity is the amount of output produced by a worker with one hour of labor input.
Labor productivity is pro-cyclical.
Capital productivity is the amount of output produced by one unit of capital input.
Multifactor productivity is the amount of output produced by all factor inputs.
Using growth accounting, the unexplained portion of output growth is defined as technological change.
Long-run increases in productivity are primarily the result of advances in and applications of knowledge.
The most important factor that leads to economic growth through time is competition, which fosters the process of creative destruction.
Governments can promote economic growth by keeping budgets deficits relatively low, subsidizing education, and encouraging saving and investment.
During the mid-1970s and 1980s productivity growth declined considerably, possibly due to oil shocks and fierce international competition.
Productivity growth has recovered somewhat in the 1990s.
Chapter Eighteen: Notes -- Economic Growth and Productivity
- The Compounding Effects of Growth
- Extensive and Intensive Growth
- Productivity
- Sources of Growth in the U.S.
- Policies to Promote Growth
- The Productivity Slowdown
- Productivity Recovery?
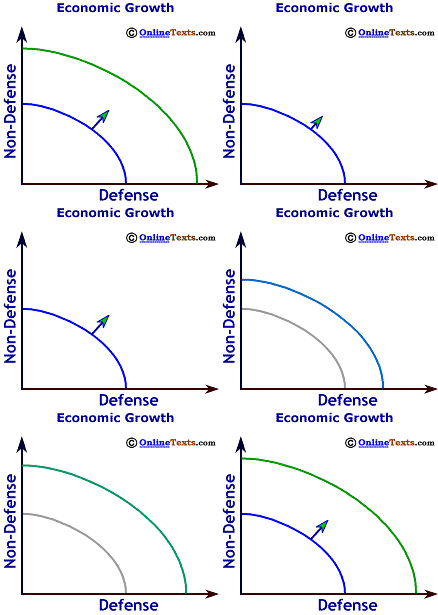
Economic growth results from an increase in the economy's total output. To quantify this process, we typically express economic growth as the annual percentage change in real Gross Domestic Product. Recall from Chapter 2 that economic growth occurs when the production possibilities frontier shifts outward. The figure titled "Economic Growth" illustrates this process.
Thus far in this text, we have focused mainly on short-run concepts. We examined how the output and the price level are determined by the interaction of Aggregate Demand and Aggregate Supply, and how fiscal and monetary policy are used as tools to stabilize the business cycle. Usually, the short run was a period of time in which the economy's output deviated from potential output; the economy was not at full employment. The long run was the period of time that it took for the economy to achieve its potential output.
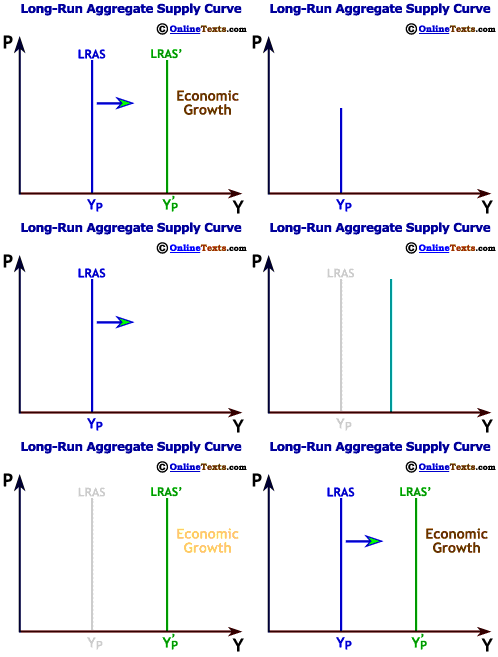
To properly analyze economic growth, we must take a much longer view. The long run may be a period of 5, 20, or even 100 years. As the figure titled Long-Run Aggregate Supply Curve" illustrates, economic growth increases potential output and shifts the Long Run Aggregate Supply (LRAS) curve to the right. As we shall see, this long-term economic growth is much more important to an economy's standard of living compared with moderating short-run fluctuations in output.
Fortunately, the two objectives of stabilizing the business cycle and achieving long-term economic growth do not conflict. In fact, price stability is viewed by many economists as a necessary condition for long-run growth to occur.
The Compounding Effects of Growth
Over long periods of time, even small differences in growth rates can lead to huge differences in living standards. Recall from Chapter 2 that GDP per capita is an economy's GDP divided by its population. This ratio is a good (though flawed) measure of the average material standard of living. Especially over the last century, the gap between the rich and the poor nations has widened substantially. This divergence is due to the higher rates of per capita growth in the wealthier nations compared with the poorer nations.
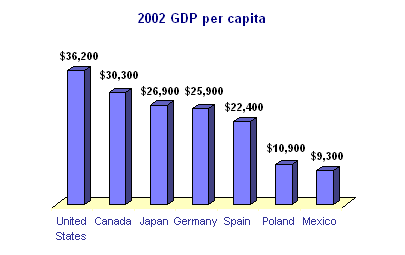
The figure titled "2002 GDP per capita" charts 2002 GDP per capita for selected countries. The United States has the highest per capita income at $36,200 but Canada, Japan and Germany are not far behind. Mexico and Poland, however, have per-capita incomes of about one-fourth the U.S. level. Although each of these countries grew fairly rapidly during the 1990s, prior years of relatively slow growth led to these large divergences. On a world-wide basis, Poland and Mexico are nowhere near the bottom of the scale. In fact, those countries are typically placed in the upper-middle income category. Countries such as Haiti and Nigeria have per capita incomes well below $1,000.
A simple tool called the Rule of 69 illustrates the power of compounded growth. As an approximation, one can divide an economy's per capita growth rate into 69 to determine the number of years it takes to double the material standard of living. Small differences in growth rates have large cumulative effects. For example, a nation in which the growth rate is 2 percent doubles its living standard every 34.5 years; in contrast, it takes just 23 years to double the standard of living if the growth rate is 3 percent.
Table 1 allows you to test the Rule of 69. Plug in the economy's growth rate and click the "Compute" button, and the number of years that it takes to double the material standard of living will be displayed.
Throughout nearly all of recorded history, most civilizations failed to achieve any consistent per-capita growth. Only in the last two centuries have economies managed to consistently improve their standards of living through time. Even today, most nations of the world have very low growth rates. Although many economies have grown tremendously in recent decades, high-growth countries like those in Western Europe and North America remain the exception, not the rule.
Extensive and Intensive Growth
Ultimately, economic growth results from the institutional framework of a nation. Rules governing property, contracts, the structure of government and so on, combined with how effectively those rules are enforced, determine how costly it is to transact. If transaction costs are relatively low, then markets arise to exchange goods and services. Producers can bear the risks of investment, for example, if they are certain that they will benefit if the project is successful. Conversely, if transaction costs are high, then individuals can not exploit potential trade and production opportunities.If a nation is already at its production possibilities frontier, then economic growth only occurs when the frontier shifts outward. Recall from Chapter 2 that the production possibilities frontier shifts outward for one of two reasons: either resources increase or technology advances. Both types of growth contribute significantly to overall economic growth and significant increases in per capita income.
Extensive growth is growth due to an increase in resource inputs. Resources consist of land, labor, and capital. Land expands when new oil fields, fertile land, and so on are discovered. Technology may also play a role, for example, in allowing oil to be tapped in places that it was impossible to reach earlier. A nation's labor force grows from some combination of relatively high birth rates, lower mortality or immigration. Finally, the capital stock increases from new investment. As firms invest in newly produced goods and services, these products are added to the capital stock. Some of the capital stock wears out over time, but as long as investment rates exceed depreciation rates, then the nation's capital grows.
Intensive growth is growth due to technological advancements, broadly defined. Intensive growth could come from the typical technological sources that we think of such as increased computer power or better ways to harness energy. United States history is full of technological innovations that radically changed our standards of living. The cotton gin, steam engine, polio vaccine, penicillin and automobiles are just a few of the thousands of examples. Each of these innovations shifted the production possibilities frontier outward.
Intensive growth also occurs when a firm learns how to better organize its production process in order to make its resources more productive. Adam Smith in the Wealth of Nations described how workers in a pin factory could produce far more pins per day if they divided the process into narrow, specialized tasks. By specializing and dividing labor, more output could be produced using the same inputs.
Productivity
Growth rates by themselves tell us little about the specific sources of growth. For example, the United States economy grew by 3.0 percent in 2003. Was this growth the result of an increase in the labor supply, an increase in the capital stock, or technological advancements? Growth in GDP per capita at least tells us what happened to output relative to population growth, but we can be much more specific by looking at productivity measures.Productivity is a measure of the ability of a resource to generate output. For example, if a doctor can see four patients each hour, then the doctor's productivity is 4 patients. Often, productivity is expressed as a measure of revenue output generated per unit of input. If a doctor charges $50 per visit, then the doctor's productivity is $200 ($50 x 4) per hour.
Productivity measures help to distinguish between extensive and intensive growth. Suppose that at a textile factory on day one, 10 hours of labor input produce 10 shirts; productivity is one. The next day--day two--20 hours of labor input are provided to produce 20 shirts; productivity remains at one. Although output doubled from 10 to 20 shirts, productivity did not change. The increase in labor input fully explains the increase in shirt production. On the other hand, suppose that on day three 20 hours of labor input produce 30 shirts. Now productivity is 1.5 (30/20). Why did output increase from 20 to 30 shirts? Either another input increased or there was a technological advancement.
Three major productivity measures exist: labor productivity, capital productivity, and multifactor productivity. We discuss each of these in turn.
Labor Productivity
Labor productivity is the amount of output produced by a worker with one hour of labor input. By dividing U.S. GDP by the total number of hours worked by the labor force in a given year, we derive the average amount of output produced per labor hour. This number is a good approximation of the hourly income of the average worker. Note that
labor productivity for the nation differs from GDP per capita because GDP per capita uses the entire population in the denominator, while labor productivity uses labor hours.
Conceptually, adding an additional labor hour--holding all else constant--will increase output but decrease labor productivity. Assume that an automobile plant hires an additional worker to mount tires on a fully staffed assembly line. Clearly, total output on the line rises because two people can mount tires faster than one person, but the two workers together cannot mount twice the amount of tires that the first worker mounted because they must both share the same mounting equipment. Because the marginal productivity of the newly hired worker is less than the marginal productivity of the other workers, adding the new worker brings the average level of productivity down for everyone on the assembly line. If the plant would hire an additional worker, average labor productivity would decline, even as output rises.
| TABLE 2 Declining Labor Productivity | ||||
|---|---|---|---|---|
| Period | Labor | Capital | Output | Labor Productivity |
| 1 | 100 | 100 | 400 | 4 |
| 2 | 110 | 100 | 425 | 3.86 |
| 3 | 120 | 100 | 445 | 3.71 |
In this example, illustrated in Table 2, the auto factory is experiencing diminishing returns. As the quantity of an input increases, holding all else constant, the marginal productivity of that input declines. Diminishing returns is a pervasive economic concept thoroughly discussed in Microeconomics. This concept led the famous nineteenth century economist, Thomas Malthus, to believe that the world was doomed to periods of massive poverty and famine. Malthus believed that diminishing returns from agricultural land would eventually lead to a food supply insufficient to feed the population.
| TABLE 3 Increasing Labor Productivity (due to increased capital stock) | ||||
|---|---|---|---|---|
| Period | Labor | Capital | Output | Labor Productivity |
| 1 | 100 | 100 | 400 | 4 |
| 2 | 110 | 120 | 460 | 4.18 |
| 3 | 120 | 140 | 530 | 4.42 |
In practice, labor productivity rarely decreases. Diminishing returns requires that all else is held constant, an assumption that rarely holds in a dynamic economy. Increases in the capital stock or technology could lead to an increase in labor productivity, even as labor inputs increase significantly. Referring back to the assembly line, suppose that a new worker was added at the same time that an additional tire mounting machine was installed.
Now, it is possible for output of the two tire mounters to double because each has his own equipment. In addition, output may more than double if the new machine is more productive than the old machine. In Table 3, we demonstrate rising labor productivity due to an increased capital stock.
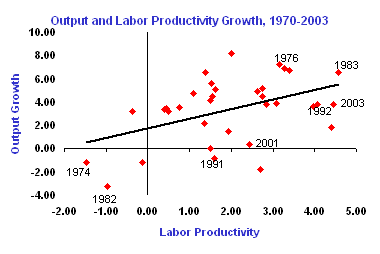
Besides being influenced by changes in capital and technology, labor productivity is pro-cyclical, meaning that it increases during economic booms and decreases during recessions. The figure titled "Output and Labor Productivity Growth" plots GDP and labor productivity growth rates between 1970 and 2003. With few exceptions, productivity and growth are positively related, as indicated by the solid upward-sloping trend line. The positive correlation between the two variables is mainly due to labor hoarding. During a recession when output declines, firms lay off workers by a lesser amount than the drop in output. Perhaps the most important reason for this behavior is that it is costly to find and train new workers when the recession ends. Firms find it less costly to be over-staffed in the short run, rather than lay off more workers only to replace them down the road. When the economy is booming (such as the late 1990s), firms generally hire fewer workers and ask their current staff to work harder and faster. Thus, labor productivity increases during periods of growth and often shrinks during recessions.
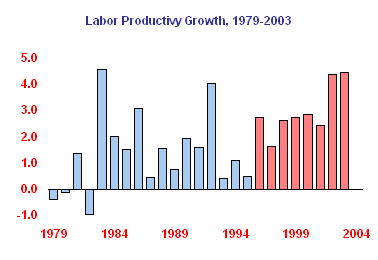
The growth rate of labor productivity is the percentage change in labor productivity from year to year. This growth rate represents the growth in output that is not accounted for by an increase in labor input. For example, suppose that labor productivity is 100 in 1999 and 105 in 2000. The 5 percent growth is due to an increase in technology, an increase in the capital stock, or any other factor besides an increase in labor input. The figure titled "Labor Productivity Growth" plots U.S. labor productivity growth rates between 1979 and 2003. Many economists argue that productivity shifted to a new higher level after 1995. The bars in the chart after 1995 are colored red to highlight the transition. Certainly, average productivity increased after 1995, but it is still too early to know definitively whether productivity growth will remain at a higher level or whether it will return to pre-1995 levels.
Over the long term, growth in labor productivity leads to rising real wages. If workers on average are producing more goods and services per hour of labor, then firms can compensate them accordingly. Consequently, wage increases driven by labor productivity growth are not inflationary. During the long U.S. economic expansion between 1991 and 2001, the Federal Reserve closely watched labor costs because of the fear that rising wages may boost inflation expectations. However, labor productivity grew quickly, meaning that the Fed did not need to be as concerned about inflationary pressures or wage increases. Consequently, monetary policy was more expansionary than it otherwise would have been had labor productivity growth rates been lower.
Capital Productivity
Capital productivity is the amount of output produced by one unit of capital input. We measure a "unit" of the capital stock by the flow of services that it provides, which is based ultimately on the rental price of the asset. (See the Bureau of Labor Statistics Summary of Methods for more details.)
| TABLE 4 Net Stock of Private Fixed Assets 1980 to 2002 (Billions $) | |||
|---|---|---|---|
| Year | Net Stock | Equipment | Structures |
| 1980 | 7,049.0 | 1,412.3 | 5,636.8 |
| 1990 | 12,716.9 | 2,637.7 | 10,079.2 |
| 1995 | 15,877.7 | 3,197.5 | 12,680.2 |
| 2000 | 21,334.6 | 4,243.6 | 17,091.0 |
| 2001 | 22,684.6 | 4,383.5 | 18,301.1 |
| 2002 | 23,412.9 | 4,460.5 | 18,952.4 |
| Source: Bureau of Economic Analysis, Fixed Asset Tables | |||
Table 4 lists the fixed nonresidential private capital stock in the U.S. for selected years between 1980 and 2002. As of 2002, the capital stock (including residential and nonresidential assets) stood at $19.0 trillion. Between 1980 and 2002, the nominal capital stock increased by an annual rate of 5.5 percent.
Like labor, capital is subject to diminishing returns. For example, suppose that a team of five construction workers are given four shovels to dig a ditch. As one member of the crew takes a break, the other worker can borrow his or her shovel. Now a fifth shovel is added; each crew member has his own shovel, and productivity increases. If a sixth shovel is provided, the crew can use it as a back-up, but the shovel will be less productive than the fifth shovel. With each additional shovel, the marginal productivity of capital declines.
Diminishing returns to capital requires that other resources (like land and labor) and technology be held constant. As with labor, this is rarely the case. If other resources increase or the quality of the capital improves, then capital productivity can increase as well. Over time, capital productivity has indeed increased in the U.S.
The interplay between resources makes it difficult to identify the sources of growth. Labor productivity may be increasing because the capital stock is rising. Conversely, capital productivity may be increasing because the labor stock is rising. To more precisely identify the combined effects of capital and labor input, we turn to multifactor productivity.
Multifactor Productivity
Multifactor productivity is the amount of output (Y) produced by all factor inputs. We represent it as Y/F(L,K), where F(L,K) represents the weighted-average level of labor and capital inputs. Multifactor productivity simultaneously accounts for the effects of multiple resources on economic growth. What cannot be accounted for by changes in resources is attributed to a catch-all category called technological change.
We will do some growth accounting in which we decompose output growth in order to understand how the multifactor productivity growth rate is derived. Let us begin with the assumption that all output is produced by combining technology (A) with two factors of production: labor (L) and capital (K), or
Y = A * F(L,K), where F(.) is the production function that converts the resource inputs into output. We then transform this equation into our growth accounting equation:

In this equation, a is the marginal productivity of labor and (1 - a) is the marginal productivity of capital. These values (which sum to one) are derived from the shares of income that flow to labor and capital, respectively.
An example will clarify this growth-accounting concept. Suppose that in a given year output growth is 4 percent, labor input grows by 3 percent, and capital input grows by 2 percent. With multifactor productivity analysis, we can more fully "explain" the sources of output growth. Let's also assume that a is 0.6 so that the marginal product of an additional unit of labor input is 0.6 units of output. We also know, then, that the marginal product of capital is (1 - 0.6) = 0.4. Plugging these numbers into our equation yields the following:
4% = 0.6 (3%) + 0.4 (2%) +  A/A , or
4% = 1.8% + 0.8% +  A/A .
A/A .
Solving for  A/A, we get:
 A/A = 4% - 1.8% - 0.8% = 1.4% .
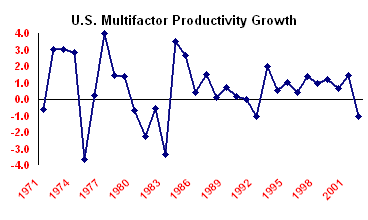
What these results tell us is that an increase in labor input accounted for 1.8 percentage points of output growth, an increase in capital input accounted for 0.8 percentage points of the growth, and the "unexplained" portion of 1.4 percent is left to technological change, which, by construction, includes everything except increases in resource inputs. Just as growth in labor productivity tells us how much output increases after accounting for growth in labor inputs, multifactor productivity growth describes how much output increases after accounting for growth in labor and capital inputs. The figure titled U.S. Multifactor Productivity Growth plots multifactor productivity growth rates between 1970 and 2001. Multifactor productivity averaged 0.7 percent during these years. Clearly, multifactor productivity growth is pro-cyclical. It falls during recessions and increases sharply during recoveries.
Sources of Growth in the U.S.
After using multifactor productivity to isolate technological advances from increases in capital and labor inputs, we wish to explore in some detail what accounts for the technological advances.An economist named Edward Denison has devoted his career to studying economic growth. He identified several factors that contributed to economic growth between 1929 and 1982. Denison argues that about half of the growth in that period was due to increases in labor and capital inputs; the other half was due to increases in productivity. Of the half due to productivity, about two-thirds of the gain came from advances in knowledge; the other one-third came from other factors such as economies of scale.
Most economists agree that long-run increases in productivity are primarily the result of advances in and applications of knowledge. An invention is an advance in knowledge, while an innovation is the use of that new knowledge to produce a new or improved product. The discovery of electricity and its properties was an invention; using electricity to light a room was an innovation. What are the factors that lead to knowledge advancement?
Investment in research and development is extremely important. Firms spend considerable amounts of money investigating new product development and more cost-effective ways to produce existing products. Patents spur this activity by financially rewarding those firms and individuals who invent new products and find new ways to produce things.
Education is also an important reason why productivity increases. If workers are better educated, then they can use their skills to find better ways to do things. The United States has a first-class higher education system that attracts international students from all over the world. Well trained workers, on average, are more creative at problem solving.
Access to information is another part of the explanation for growing productivity. The computer and Internet revolution are transforming the way we receive information. Some economists believe that all the investment in computers is just beginning to pay big dividends for firms as they can communicate with customers in low-cost ways that did not exist before.
Perhaps the most important factor that leads to economic growth through time is competition. If firms vigorously compete with one another for market share, they must continue to innovate. Firms that do not innovate and keep up in the dynamic world will wither. Another famous economist, Joseph Schumpeter, termed this dynamic competition the process of creative destruction. Firms that create new products that consumers want will drive other firms out of business. The profound effect of imported Japanese automobiles on the U.S. auto market is an excellent example of this fierce competition. Prior to the 1970s imported automobiles accounted for only a tiny fraction of automobile sales in the U.S. These imports were widely considered to be more reliable, were unquestionably more fuel-efficient and, for a time, were less costly than most U.S. cars. The failure of the U.S. auto makers to respond with comparable alternatives quickly enough led to a considerable loss of market share that has never been recovered. This competition eventually forced the big three auto makers to incorporate features and manufacturing approaches used by their foreign competitors.
Many countries do not have a competitive economic environment. Socialist economies--by design--eliminated competition and granted state-owned firms monopoly power. The lack of competition eventually led to the fall of the socialist economic system; socialist economies failed to generate the dynamic technological change that was so pervasive in western economies in the post-World War II era. A quick comparison of East and West Germany before reunification makes this point strikingly clear.
In addition, many--indeed most--capitalistic economies throughout the world fail to foster the process of creative destruction. Countries like Brazil and Mexico, for example, rely mainly on markets to provide goods and services, but the level of government involvement in the market is so high that firms often behave as if they have de facto monopolist status. Many countries also impose high tariffs to reduce the level of competition from other nations, a policy that often helps to keep these nations relatively poor.
Policies to Promote Growth
In the context of a stable economic environment, government may be able to intervene or act in a certain manner in order to boost economic growth rates. One measure is to limit the size of budget deficits. Recall that large structural deficits potentially raise interest rates and crowd out private investment. The slower rates of investment dampen economic growth.A government may wish to subsidize education. Such a policy can be justified on efficiency grounds if positive externalities from education are significant. A more educated work force improves the quality of labor input.
High levels of saving lead to high levels of investment over the long run. Policies that promote saving will likely boost economic growth. The U.S. has had persistently low savings rates for decades. Some economists have advocated a value added tax in order to increase savings. A value added tax is eventually passed through to consumers in the form of a sales tax; hence, it discourages consumption and encourages saving.
A related tax policy is the reduction of the capital gains tax. High capital gains taxes are thought to discourage investment because individuals and firms are taxed not only on income, but also on asset appreciation from saving and investment activities. A reduction of this tax may spur more saving and investment.
These are just a few of the possibilities that policy makers have at their disposal in order to influence long-term growth. However, the most important task that a government has is to create a stable economic environment that encourages individuals and firms to save and invest.
The Productivity Slowdown
Even highly competitive economies such as the United States experience periods of rising and falling productivity growth. In general, the U.S. and other wealthy nations have managed to consistently increase productivity.
| TABLE 5 Productivity Growth Rates for Selected Years | ||
|---|---|---|
| Years | Labor Productivity | Multifactor Productivity |
| 1947-1973 | 2.78 | 1.88 |
| 1974-1980 | 1.44 | 0.61 |
| 1981-1990 | 1.51 | 0.32 |
| 1991-1995 | 1.53 | 0.60 |
| 1996-2001 | 2.50 | 0.80 |
| Source: Bureau of Labor Statistics | ||
Several possibilities have been examined. First, perhaps bigger mistakes in measuring productivity rendered the statistics less reliable. U.S. production has moved steadily into services over the years, and service sector productivity is inherently more difficult to measure than manufacturing. Economist Robert Gordon undertook a large study to estimate the impact of measurement error on the productivity numbers. He concluded that, at most, measurement error accounted for one-third of the slowdown. Moreover, real wages had not changed much during the 1974 to 1990 period, suggesting that the slowdown was real.
A primary culprit is the two severe oil shocks that the U.S. economy experienced in the mid- and late-1970s. Recall that oil shocks shift the Aggregate Supply curve to the left, reducing output. Certainly these supply shocks had a big effect on our economy; however, energy prices fell dramatically in the 1980s, yet productivity growth remained low.
Another possibility is that other countries such as Japan caught up to the U.S. level of technology. Japan tremendously increased its imports of automobiles into the United States in the 1980s. In addition, the dollar was extraordinarily strong in the mid-1980s, lowering the cost of imports. Demand for domestically produced goods and services declined as demand for imported products rose.
We are not sure exactly what caused the productivity slowdown after 1973. In fact, productivity growth was not all that low to begin with relative to historical trends. Perhaps the golden era is the real mystery. Why was productivity growth so high during that period? A slowdown did indeed occur after 1973, and, most likely, each of the factors mentioned above contributed to the relative slowdown. More definite answers await further research.
Productivity Recovery?
As Table 5 above illustrates, productivity growth recovered somewhat after 1995. Labor productivity growth averaged 2.50 percent between 1996 and 2001. Most likely, the booming economy of the late 1990s played a large role in boosting productivity growth, but this may not be the whole story. Many people believe that computers have finally become powerful enough and people are proficient enough at using them to truly enhance productivity. During the late 1980s and early 1990s a paradox arose in that firms were spending billions of dollars on computer equipment, yet productivity did not respond. Perhaps the efficiencies that computers are supposed to bring are finally appearing in the statistics. Time will tell if productivity has indeed recovered or if Aggregate Demand is simply outpacing resource inputs.Economic growth and higher levels of productivity are the keys to higher living standards through time. Short-run business cycle stabilization is a noble goal--and we have spent much time discussing how to achieve
stabilization--but long-run growth ultimately determines the wealth of nations. Evaluation of economic policies should always include a discussion of the impacts that policies will have on long-run growth.