
Chapter Two: Notes -- Graphing & Slopes
- A Primer on Graphing & Slopes
- Scarcity & Opportunity Cost
- Production Possibilities Frontier
- Principle of Increasing Costs
- Economic Growth
Slope is the rise over the run, or the change in Y divided by the change in X.
A Primer on Graphing & Slopes
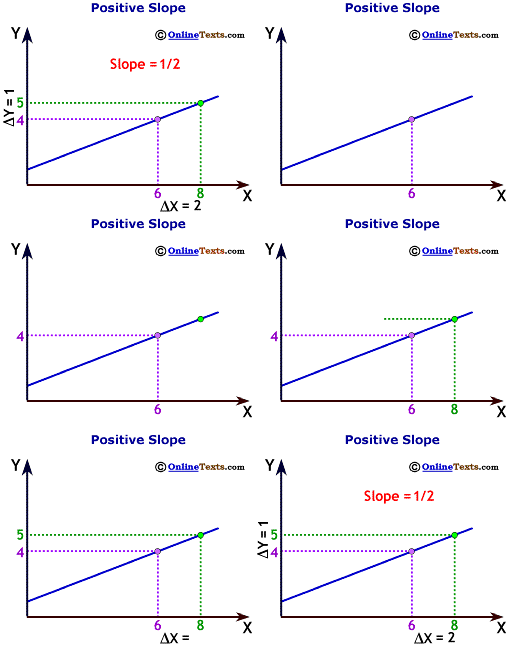
Because economics relies heavily on charts to illustrate key concepts, we briefly review the basics of graphing. Each point on a two-dimensional chart represents a point in the (x,y) plane. For example, a point at which the X value is two and the Y value is four is represented as (2,4).The slope of a line is the rise over the run, or the change in Y divided by the change in X, where the Y axis is the vertical axis and the X axis is the horizontal axis. In the figure titled "Positive Slope," one point on the line is situated at the (x,y) coordinate (6,4). Another point is at (8,5). Because we move up the Y axis 1 unit while moving across the X axis 2 units, the slope is 1/2. Note that the slope is positive, implying that X and Y are directly related. When X increases so does Y. An economic example of two directly variables are consumption and income. When income rises, consumption rises as well.
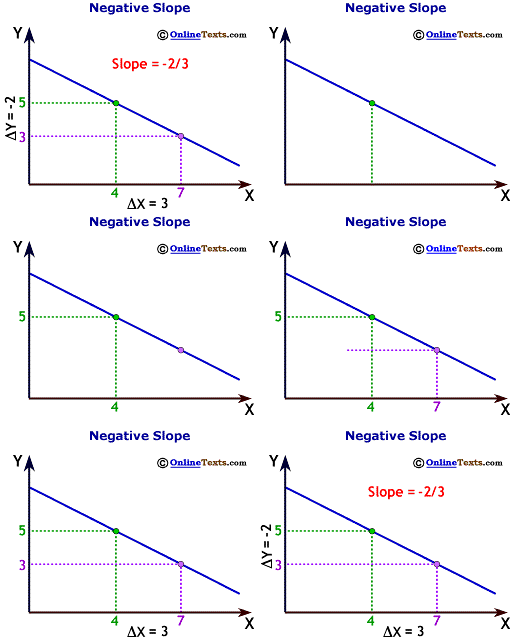
The figure titled "Negative Slope" shows a point at (4,5) and another point at (7,3). The Y value falls two units as the X value rises by 3 units. The slope of this line is -2/3. In this case, X and Y are inversely related. When X increases, Y decreases. Two economic variables that are often inversely related are inflation and unemployment. When inflation rises, unemployment tends to fall, and vice versa.
 |
 |
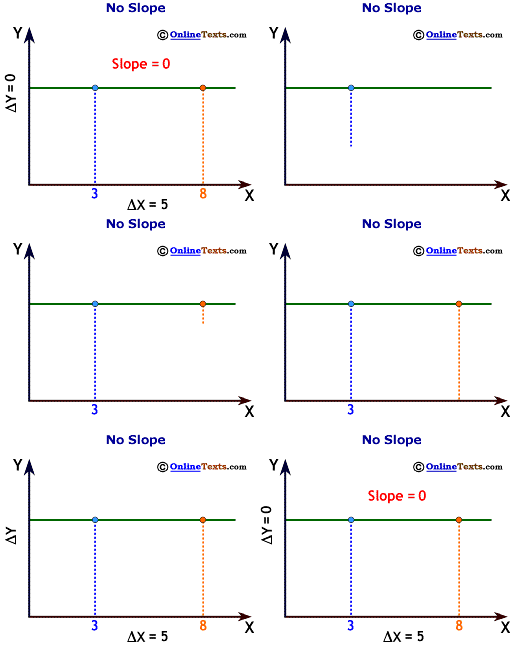
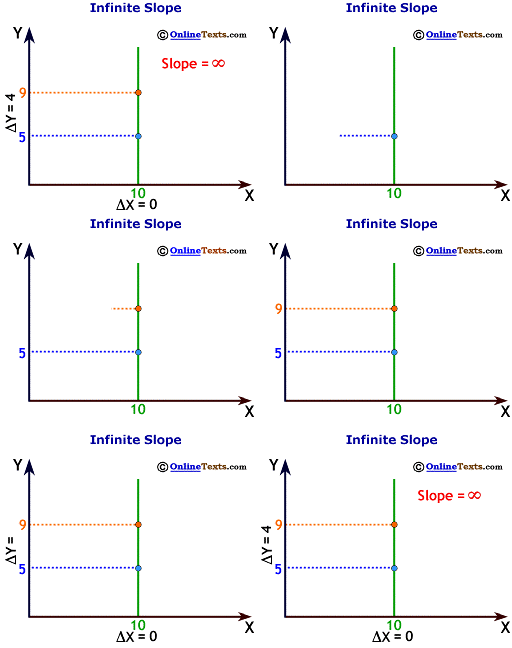
The line in the figure labeled "No Slope" is flat. Because the Y value does not change no matter how much X changes, the slope is zero. In this case, X and Y are not related. Finally, the figure labeled "Infinite Slope" illustrates a perfectly vertical line. This time the X value does not change, regardless of the Y value. We therefore divide the change in Y by zero to calculate the slope, which results in an infinite slope. As with the "No Slope" diagram, X and Y are not related. The (real) price of bread and the (real) price of a computer are unrelated.
 |
 |
Scarcity & Opportunity Cost
Wouldn't the world be a wonderful place if we could consume all the goods and services we wanted and never had to worry where the money came from? Unfortunately, the world is not such a kind place. Each one of us has limited resources, and we must make choices as to how we will use those resources. The science of economics is concerned with the rationing of scarce resources.
Scarcity occurs when, at a zero price, quantity demanded is greater than quantity supplied.
Few things in life are not scarce: water and air are two examples. These are two free goods for which there is usually no shortage. This statement, however, comes with certain qualifications. "Clean" air may indeed be scarce. The same is true for "drinkable" water. We may indeed be willing to pay for these resources when they are not abundantly available.
Scarcity helps us to understand the concept that resources are limited and we cannot have everything that we want. Given our limited resources, we must make choices about where our resources should go. Every choice we make, then, involves a cost. For example, when we choose to go to the movies, we simultaneously give up a dinner at a restaurant. When we vote for one candidate, we simultaneously sacrifice the opportunity to vote for the opposing candidate.
Opportunity cost is not always the dollar cost of a particular choice. For example, consider the opportunity cost of going to college when your next best alternative is to work full time and live in an apartment. The opportunity cost of college is not just the tuition (say, $4,000 annually) and books ($1,000). What else are you giving up? In order to attend school, you must forego the income from not working full time (say, $12,000). Tuition and books are the explicit dollar amounts that you must spend in order to attend college, but your time is also valuable, and choosing to spend time in college means sacrificing the income from a full time job. Therefore, the annual opportunity cost of attending college is $4,000 + $1,000 + $12,000 = $17,000 per year.
Production Possibilities Frontier (PPF) represents all possible combinations of the production of two goods given the available resources and technology.
Production Possibilities Frontier
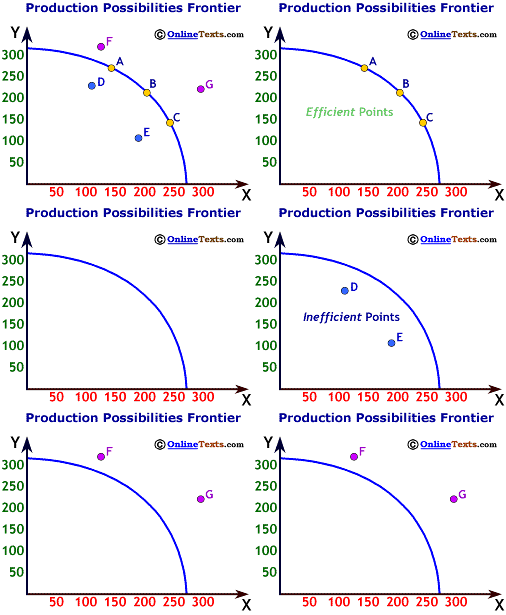 We can represent the concepts of scarcity and opportunity cost in a graphical illustration. A Production Possibilities Frontier (PPF) represents all possible combinations of the production of two goods given the available resources and technology. In the figure titled "Production Possibilities Frontier," we plot all the possible combinations of goods X and Y that society can produce, given its resources and technology.
Resources consist of labor--the human inputs into production, land--the gifts of nature such as water and oil, and capital--the human-made inputs to production such as machines and tools. We combine these resources in order to produce the final goods and services. For example, the production of an economics class requires labor (faculty, administration, and student input), land (the physical space that the class room is on), and capital (the desks, overhead projector, chalk, chalkboard, books, and so on).
There are several important concepts to note when analyzing a production possibilities frontier:
- Points on the line are efficient, implying that all resources are fully utilized. Points A,B,C in the graph are efficient.
- Points inside the line are inefficient, meaning that some resources are not being utilized fully. Perhaps there is excess unemployment, in which case labor resources are sitting idle. Maybe some capital machinery is only being run at 50 percent capacity, so idle capital exists. Points D and E in the figure are inefficient.
- Points outside the line are unattainable. Given the available resources and technology, the economy cannot yet produce that combination of goods. Points F and G in the figure are presently unattainable.
- Any given point on the frontier is no better than any other point in terms of efficiency; points A, B and C all fully utilize resources. The "better" point is subjective, dependent upon people's values. One individual, for example, may believe that society needs to spend more resources on good X, while another person believes that society should devote more resources to good Y.
- When the economy moves from one point on the frontier to another point on the frontier, there is always an opportunity cost. Because resources are limited, something must be given up in order to gain something else. The production possibilities frontier illustrates that producing more of good X by moving from point A to point B necessarily means sacrificing some of good Y.
- The slope of the line represents the opportunity cost of increasing the X good by one unit. Because the production possibilities frontier typically bows outward, the absolute value of the slope of the frontier increases. We return to this concept below. Notice also that it is possible to move from an inefficient point like D to an efficient point like A and not incur any opportunity cost. This costless move occurs because the economy is simply putting idle resources to work and producing more output.
Here are a few common examples of tradeoffs that our society faces. Can you plot each of these in a production possibilities frontier?
- Guns versus butter debate: This debate highlights the classic tradeoff that all nations face between producing defense-related items (guns) and non-defense items (butter). How much of a nation's resources should be devoted to defense spending, given that the opportunity cost is the foregone opportunity to employ those resources elsewhere? Following the terrorist attacks on September 11, 2001, the U.S. government decided to allocate more resources to airline security. What is the opportunity cost?
- Gender equity in college sports: A tradeoff exists between resources for women's and men's sports. Does increasing women's sports necessarily mean that some men's sports have to be sacrificed?
- Regulation of drugs: The Food and Drug Administration (FDA) must decide whether or not to approve new drugs to be sold to the public. The possibility of harming someone with an approved but unsafe drug is a "Type I" error. The possibility of harming someone by restricting access to otherwise safe drugs is a "Type II" error. The FDA deals with this tradeoff every day. Do you think that the agency would rather limit Type I or Type II errors? Why?
- Crime prevention: How much should government spend on crime prevention? Can society spend too much on crime prevention? What is the opportunity cost?
- Medicare coverage of prescription drugs for the elderly: Although most people would welcome the opportunity to provide better health-care coverage to the elderly if it were costless, can the U.S. afford it? The opportunity cost will be less resources spent on other deserving programs.
The Principle of increasing costs holds that as production of a good or service increases, the opportunity cost of producing another unit generally rises.
The Principle of Increasing Costs
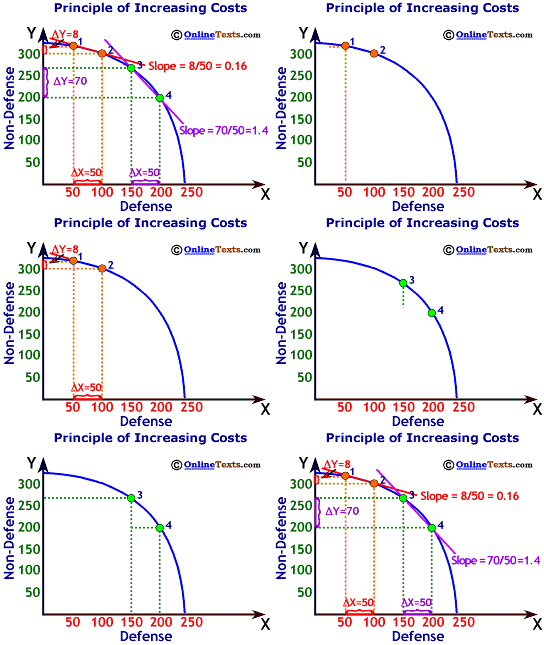
Why does the production possibilities frontier bow outward? We have intentionally drawn the curve this way to reflect the principle of increasing costs. The Principle of increasing costs holds that as production of a good or service increases, the opportunity cost of producing another unit generally rises.
This principle holds because resources tend to be specialized so that some of their productivity is lost when they are transferred from what they do well to what they do poorly. One can see in the figure titled "Principle of Increasing Costs" that the opportunity cost rises with the production of more and more defense goods. To move from point 1 to point 2, gaining 50 units of defense goods, the economy must sacrifice just 8 units of non-defense goods. (The slope is 8/50 = 0.16.) Yet the opportunity cost of moving from point 3 to point 4--again an increase of 50 units of defense goods--increases dramatically to 70 units of non-defense production. (The slope is 70/50 = 1.4.) As production of defense goods increases, the opportunity cost also rises.
An example should help to clarify this concept. Suppose that all workers in the economy are trained for just one of two occupations: soldiers or computer programmers. Initially the economy produces at point 1 in the graph. Because the economy is producing so many computer programs (non-defense goods) and just a few defense goods at point 1, a number of soldiers are employed as programmers, an occupation at which they are untrained. As the economy moves from point 1 to point 2, the best soldiers (and the worst programmers) are transferred from computer programming to being soldiers in the military. Production of software falls, but not by much because the soldiers who were programming were not highly productive.
Now suppose that the economy is producing on the frontier at point 3, a point at which all the soldiers are producing defense goods and all the programmers are writing software. As the economy moves from point 3 to point 4, some of the programmers must join the military. The opportunity cost of shifting those workers from programming to being soldiers is relatively high because the programmers were more productive in their jobs than the soldiers were. In addition, the programmers make poor soldiers, so more of them have to be transferred to increase defense production by 50 units. As this example illustrates, the resource specialization accounts for the rising opportunity costs as more defense goods are produced.
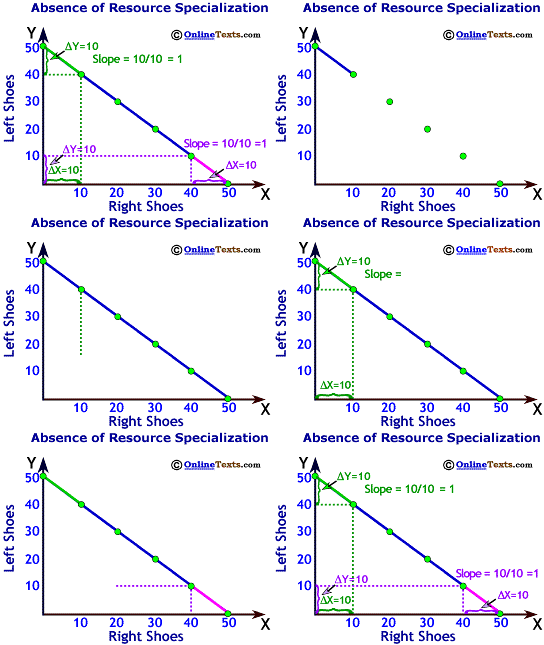
When resources are not specialized, the principle of increasing costs does not apply and the production possibilities frontier is a straight line. This scenario is represented in the figure titled "Absence of Resource Specialization," which plots the production of right shoes versus left shoes. Resources required to produce each of these products are very similar; therefore, the opportunity cost of producing one more right shoe is always one left shoe.
Economic growth is the increase in the economy's level of production.
Economic Growth
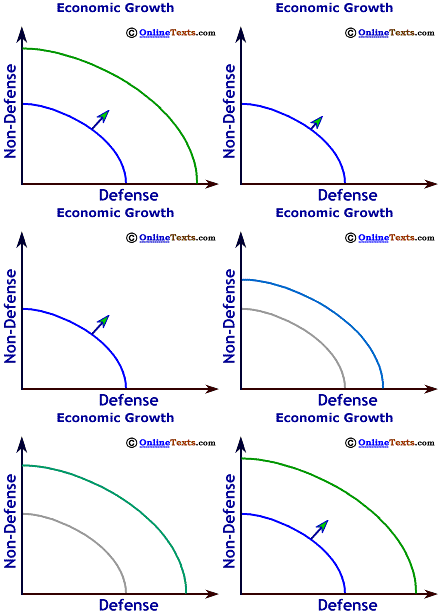
Economic growth is the increase in the economy's level of production. Recall that the production possibilities frontier shows the possible production of two goods given the available resources and technology. Economic growth can occur because either the resource base expands or the level of technology increases.
Economies grow, for example, when the population grows because labor is an important resource. The United States economy grew from a population of about 5 million in 1800 to over 90 million in 1900. This era was a time of massive resource growth in U.S. history.
Economic growth also occurs when nations learn how to use their existing resources more productively. This process is what we call technological progress. For a given amount of resources, the economy's level of output increases. In either case, economic growth results in a shift outward of the production possibilities frontier as seen in the figure titled "Economic Growth."