
Copyright © 1995-2004 OnLineTexts.com, Inc. - All Rights Reserved
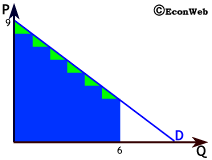
 A Small Detail: The alert student may have noticed that the values we compute for consumer surplus, total and marginal willingness to pay, and total expenditure are slightly different using values given in a table than if we compute the value of triangular shaped areas from a graph.
We we use data such as those presented in the table on page 6, we aren't able to include the small triangular areas show to the right in green. Instead, all our calculations are based on areas equivalent to the rectangular areas shown in blue. Since both types of data are meant only for illustration in a course like this, it's not a significant issue. If you're presented with a test or homework problem, simply do the computation based on the way the data are presented, in graphical or tabular form.


Copyright © 1995-2004 OnLineTexts.com, Inc. - All Rights Reserved