

Copyright © 1995-2004 OnLineTexts.com, Inc. - All Rights Reserved
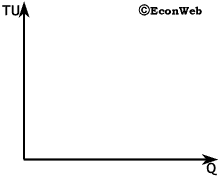 To the right we show a graph of Total Utility (measured on the vertical axis) as quantity consumed increases. Suppose this is some consumer's total utility for episodes of South Park watched in a year (we don't explain tastes, just the economics :). This individual's total utility from watching 5 episodes is 15, 18 episodes gives her a total utility of 25 and 36 episodes give her a total utility of 32.
Just as we expected, total utility increases as more episodes are watched, but the curve becomes less steep as quantity increases. As much as she enjoys South Park, her total utility is increasing more slowly the more episodes she watches. This is due to diminishing marginal utility. It turns out that the slope of the total utility curve is marginal utility.
Copyright © 1995-2004 OnLineTexts.com, Inc. - All Rights Reserved