
Copyright © 1995-2004 OnLineTexts.com, Inc. - All Rights Reserved
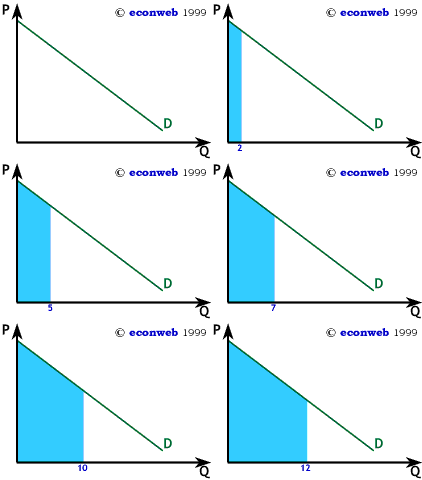
 Since the demand curve is also a marginal utility curve, the area under the demand curve, to the left of the quantity being consumed, is total utility for that quantity.
We show to the right that total utility increases with each unit consumed from 1 to 12, the size of the blue shaded area. Even though we're measuring utility as the area under the demand curve, the amount of utility enjoyed doesn't depend on how much our consumer had to pay for each unit, or even if she had to pay at all.


Copyright © 1995-2004 OnLineTexts.com, Inc. - All Rights Reserved