
Copyright © 1995-2004 OnLineTexts.com, Inc. - All Rights Reserved
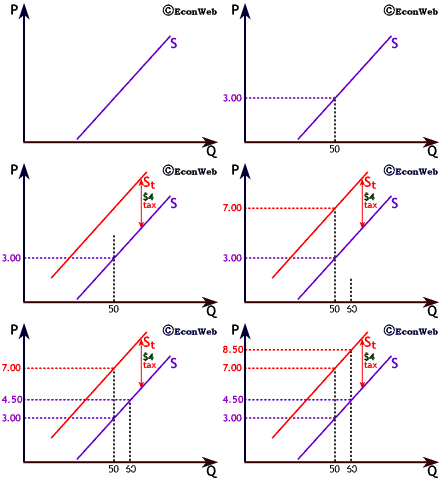
 We illustrate an excise tax by adding a second supply curve St shifted up from the original (pre-tax) supply curve, S. The original supply curve, S, shows desired quantity supplied based on the amount per-unit the firm can keep as revenue while the new, higher curve, St represents desired quantity supplied based on price paid by purchasers.
We can think of the lower curve S as being the supply curve based on "Suppliers' Price or Producers' Price or Pre-tax Price." This is the amount the firm actually keeps as revenue for each unit sold, and supply curve St as being based on the "Consumers' Price or After-tax Price or just Retail Market Price," the actual retail amount paid by consumers.


Copyright © 1995-2004 OnLineTexts.com, Inc. - All Rights Reserved