
Copyright © 1995-2004 OnLineTexts.com, Inc. - All Rights Reserved
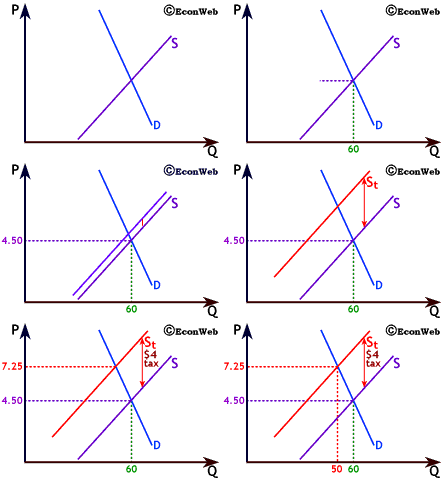
 Recall that, for the purpose of comparison, we can represent relatively elastic demand with a fairly flat demand curve and more inelastic demand with a steeper demand curve. The demand curve shown on the graph to the right illustrates relatively inelastic demand, compared with the more elastic demand curve shown on the previous graphs.
More inelastic demand leads to several differences after the tax is imposed. Notice that the equilibrium price increases to $7.25 instead of $6.00 and quantity falls to 50 rather than to 40 units. As we learned in the elasticity section, if demand is inelastic supply changes lead to larger price and smaller quantity effects.


Copyright © 1995-2004 OnLineTexts.com, Inc. - All Rights Reserved