
Copyright © 1995-2004 OnLineTexts.com, Inc. - All Rights Reserved
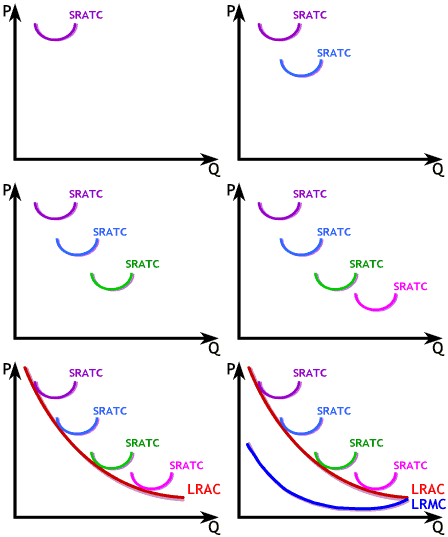
 The graph to the right is a LRAC curve for a firm with Increasing Returns to Scale. Each point
on the LRAC curve represents a different production set up, maybe even a
different factory, so each has its own associated SRATC curve. If the firm were to change its output in the short run
we would look to the short run cost curves to understand how costs
are changing. In the long run, when everything is variable, it moves along its LRAC curve.
Notice that LRMC must always be below the LRAC curve if the LRAC is always downward sloping. Industries with declining LRAC are also known as natural monopolies since, in the absence
of regulation, the industry would evolve into a monopoly naturally
due to the cost advantage of being large.


Copyright © 1995-2004 OnLineTexts.com, Inc. - All Rights Reserved