Copyright © 1995-2004 OnLineTexts.com, Inc. - All Rights Reserved
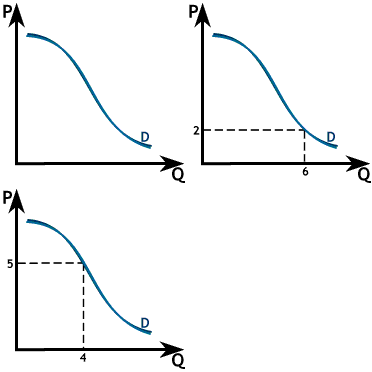
 There is no reason that demand can't be illustrated by a curved
line, such as the one to the right. We do expect the relationship
to be downward sloping, in virtually every case. As before, this
graph indicates that as the price falls, more will be demanded; and as the
price rises, less will be demanded.
In our example, as the market price rises from 2 to 5, the desired quantity demanded falls from 6 to 4.

Copyright © 1995-2004 OnLineTexts.com, Inc. - All Rights Reserved