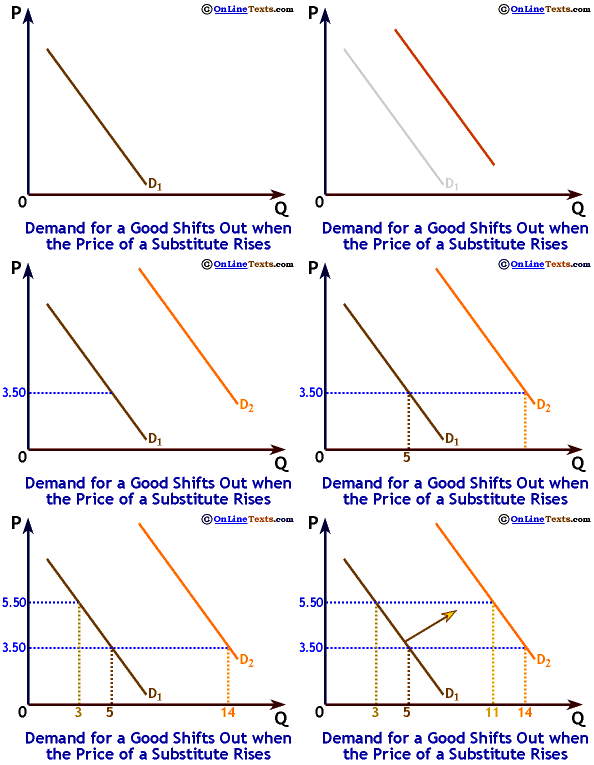
Suppose some consumer prefers Coca Cola, but sometimes buys Jolly Time cola to save money. If the price of Jolly Time Cola increases, this consumer will buy less Jolly Time and more Coca Cola.
The graph to the right shows this consumer's demand for Coca Cola. The prices shown on the vertical axis are prices for Coca Cola, the price of, and demand for, Jolly Time are not shown. When the price of Jolly Time cola is $2.00 per 12-pack, our consumer's demand for Coca Cola is given by demand curve D1. On demand curve D1, when Jolly Time sells for $2.00, if Coke sells for $3.50 per 12-pack our consumer will buy 5 per month; if Coke sells for $5.50 per 12-pack she will buy 3 12-packs per month. If the price of Jolly Time cola increases to $3.00 per 12-pack, our consumer saves less when she buys Jolly Time, so her demand for Coca Cola will shift out (increase) to the demand curve labeled D2. On demand curve D2, when Jolly Time sells for $3.00, if Coca Cola sells for $3.50 she buys 14 12-packs per month; if Coca Cola sells for $5.50 she buys 11 per month. An increase in the price of Jolly Time soda caused her demand for Coca Cola to increase (shift out).

