
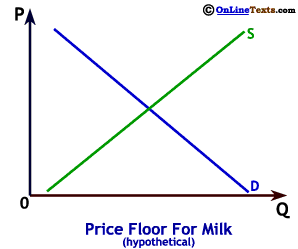
We use a hypothetical example to illustrate the imposition of a price floor.18 On the graph to the right the vertical axis gives the price of a gallon of milk. The horizontal axis gives the quantity of milk (in gallons) consumed by an average household of 4. In this hypothetical example, the equilibrium price of milk is $1.80 per gallon and the typical household buys 25 gallons per month.
Suppose the dairy industry convinces congress to set a Price Floor for milk at $3.00 per gallon. At this price the typical household buys 10 gallons per month, but the dairy industry supplies enough milk for each household to have 40 gallons per month. This leads to a surplus of milk of 30 gallons per month per household! The demand curve shows that if all that milk is allowed on the market, the price of milk will fall to 60 cents per gallon. We can see from the demand curve that when 40 gallons per family is available, 60 cents per gallon is the value placed on, or the willingness to pay for, another gallon of milk.
The point of the policy is to keep the price of milk high, so this surplus milk cannot be sold or otherwise made available to consumers. To support the $3.00 price, the government must buy 30 gallons of milk per household and keep it out of the hands of consumers. In our hypothetical example, if there are 100 million such households, the government would need to buy 300 million gallons of milk per month, spending about $900 million per month - $10.8 billion per year, to support this Price Floor!

None of these numbers are based on actual data. U.S. agricultural programs and policies to support prices are rarely as simple as a basic price floor, but they are very costly.