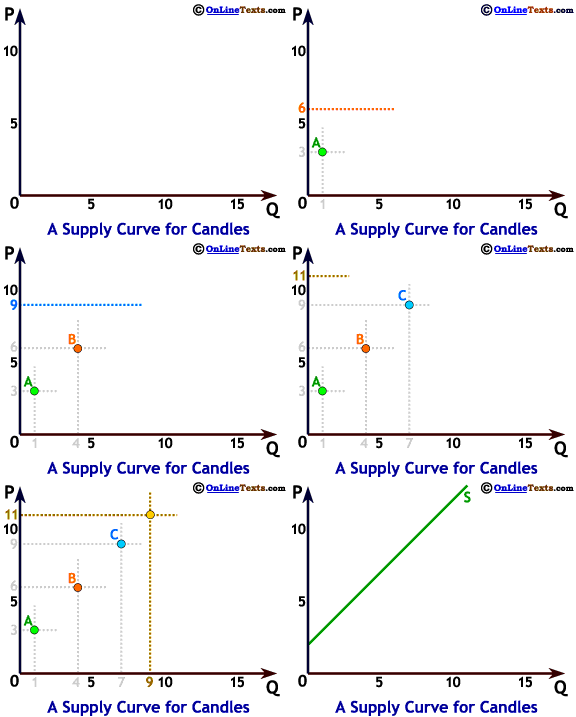
Consider a hypothetical daily supply curve for a very small one-person business making aromatherapy candles to sell at the local health food store. The supply relationship is given in the table to the right. When the price is 2 or lower it isn't worth it to supply any candles. At a price of 3 she will produce 1, while at a price of 6 she would like to sell 4 each day, and so on.
As the price increases, it becomes worthwile to give up other activities and devote more time and resources to producing candles, leading to an upward sloping suppy curve. This relationship is plotted as the green line labeled S, in the graph titled A Supply Curve for Candles. We can also express this particular relationship with the simple equation:
QS = P - 2


| Daily Candle Supply | ||
|---|---|---|
| Price | Quantity | |
| 2 | 0 | |
| A | 3 | 1 |
| B | 6 | 4 |
| C | 9 | 7 |
| D | 11 | 9 |
