Copyright © 1995-2004 OnLineTexts.com, Inc. - All Rights Reserved
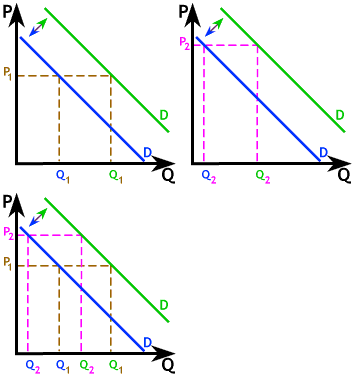
 The graph to the right illustrates a change or shift in demand. The change could be an increase or shift out in demand (movement from the blue demand to the green demand), or a decrease or shift back in demand (movement from the green demand to the blue demand), depending on the cause. Such shifts in demand occur because
a factor other than price has changed, leading to a new relationship
between price and desired quantity demanded.
The graph here shows the new demand relationship, parallel to the
old linear demand relationship. However, slope and linearity can both be altered, when
demand changes or shifts.

Copyright © 1995-2004 OnLineTexts.com, Inc. - All Rights Reserved