
Copyright © 1995-2004 OnLineTexts.com, Inc. - All Rights Reserved
 As we said, we expect the basic supply relationship to be one
in which prices and the desired quantity supplied are positively related (moving in the same direction). Graphically,
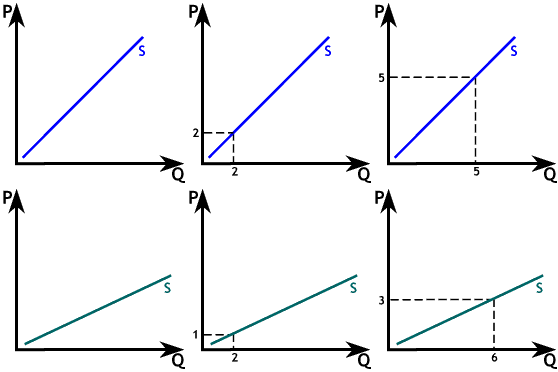
this would appear something like the examples in the graph to the right; as the market
price P rises, the desired quantity supplied Q rises as well.
We show an example of 2 supply curves. With the blue supply curve, as the market price rises from 2 to 5, the quantity supplied rises from 2 to 5. Looking at the green supply curve, we see that as the market price rises from 1 to 3, the quantity supplied rises from 2 to 6. In both cases, as the market price rises, the desired quantity supplied rises too.


Copyright © 1995-2004 OnLineTexts.com, Inc. - All Rights Reserved