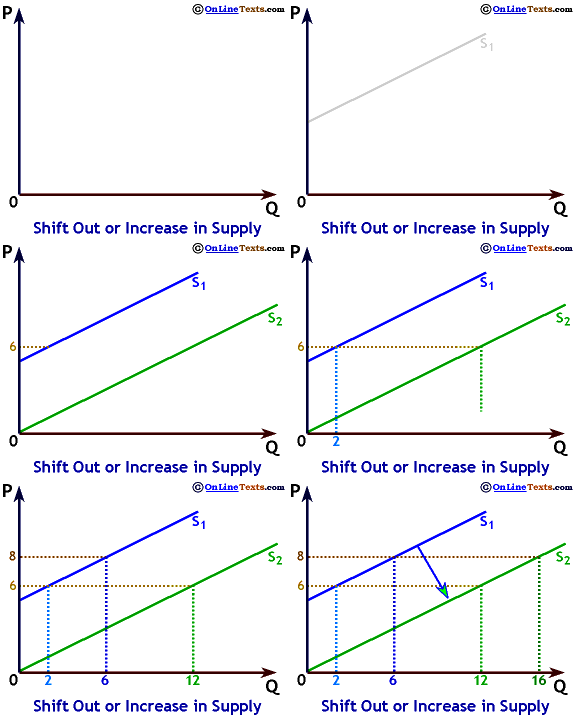
The graph to the right shows an increase, or shift out, of supply. At first, this may look like a decrease in supply since the new supply curve is "lower" than the old one, but as the numbers will make clear, it actually represents greater supply. We usually say that supply shifts "out," or "out and to the right," or "to the right" rather than shifts "up" to reduce the possibility of confusion.
When the market price is 6 if current supply is given by supply curve S1, 2 units will be supplied, but at the same price on supply curve S2, 12 units would be supplied. When the market price is 8, if supply is given by S1, 6 units would be supplied, while 16 would be supplied if the supply curve were S2. More is supplied at every price under S2 than when S1 holds.
S1 can be written as:
Supply curve S2 can be written as:

