
Copyright © 1995-2004 OnLineTexts.com, Inc. - All Rights Reserved

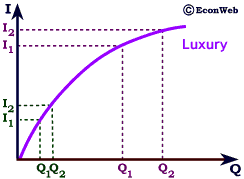
Note, on the graph to the left, we illustrate equal size income
changes at different levels of income. The movement from I1 to I2 is the same in income size as that from I1 to I2, but the quantity response Q1 to Q2 is much smaller than Q1 to Q2. The response to increases in income is larger the higher the income, as one would expect for a luxury good.


Copyright © 1995-2004 OnLineTexts.com, Inc. - All Rights Reserved