
Copyright © 1995-2004 OnLineTexts.com, Inc. - All Rights Reserved


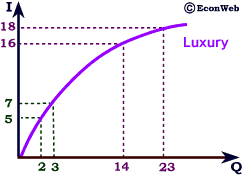
Here, I1 = 16 and I2 = 18 and Q1 =14 and Q2 = 23. The arc income elasticity computation is shown to the right. As income rose the income elasticity increased. This would be typical of fine dining, expensive wine,
sports cars and similar items.


Copyright © 1995-2004 OnLineTexts.com, Inc. - All Rights Reserved