Copyright © 1995-2004 OnLineTexts.com, Inc. - All Rights Reserved

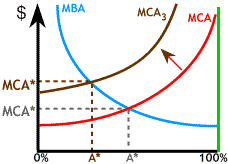
Finally, if pollution reduction costs rose, this would shift out the MCA curve to MCA3, as shown, reducing optimal abatement (increasing optimal pollution).
While we don't expect to have the kind of information needed to accurately draw
these curves, we can see that the idea of "optimal pollution" makes perfect sense and we can see that the amount of pollution which is optimal changes with changes in costs and benefits of reduction.

Copyright © 1995-2004 OnLineTexts.com, Inc. - All Rights Reserved