
Copyright © 1995-2004 OnLineTexts.com, Inc. - All Rights Reserved
 The economic logic behind the demand for factors of production is simple. A firm purchases or hires an input whenever the cost of hiring the factor is below the increased reveune it will generate. If the cost is greater than the extra revenue the factor isn't hired.
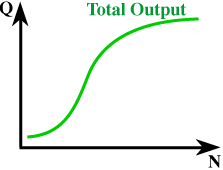
To the right is a Total Output graph for a typical input. On the horizontal axis N is the number of units of the factor, on the vertical axis, Q is the Total Output. Notice that output increases at a decreasing rate.


Copyright © 1995-2004 OnLineTexts.com, Inc. - All Rights Reserved