
Copyright © 1995-2004 OnLineTexts.com, Inc. - All Rights Reserved
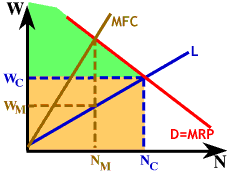
 Does it pay to be a monopsonist? Yes! The graph to the right shows the total labor cost WC
x NC (orange shaded area) if the firm hired labor in a competitive market. Total revenue generated by labor is the area under the labor demand curve, D to the left of NC (the green + orange shaded areas).
The green area represents the profit contributed to the firm by labor, or a competitive hiring surplus for the firm. Now let's compare that with the labor's profit contribution under monopsony hiring.


Copyright © 1995-2004 OnLineTexts.com, Inc. - All Rights Reserved