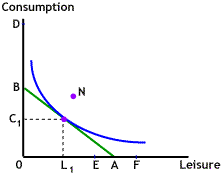

 10. The graph to the right shows an indifference curve and consumption/leisure trade-offs available to some individual. We can represent an increase in the wages of this individual by:
- shifting the budget line to the right.
- drawing a new budget line from points E to D.
- drawing a new budget line from points A to D.
- drawing a new budget line from points B to F.
- shifting the indifference curve away from the origin.


Copyright © 1995-2004 OnLineTexts.com, Inc. - All Rights Reserved
 10. The graph to the right shows an indifference curve and consumption/leisure trade-offs available to some individual. We can represent an increase in the wages of this individual by:


