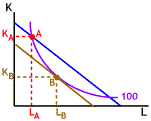

 15. A quick examination of the graph should make it clear that the firm should reduce the amount of capital its using and increase the amount of labor. The graph to the right shows the optimal captial labor mix for this firm to product 100 units at current factor prices. Clearly capital must be reduced from KA to KB and labor increased from LA to LB. This means only choices a or b could be right, we've already eliminated c-e. Remember that the slope of the isoquant is the MRTS, or the ratio of the marginal products of the inputs, and the slope of the isocost line is the ratio of factor costs. But even if we don't remember that it should be clear that
  , because this means that the increase in output of labor relative to capital is greater than the increase in the cost of labor relative to capital. In other words it pays to hire more labor because the rate at which labor can be substituted for capital in production is greater than the ratio of their costs.


Copyright © 1995-2004 OnLineTexts.com, Inc. - All Rights Reserved
 15. A quick examination of the graph should make it clear that the firm should reduce the amount of capital its using and increase the amount of labor. The graph to the right shows the optimal captial labor mix for this firm to product 100 units at current factor prices. Clearly capital must be reduced from KA to KB and labor increased from LA to LB. This means only choices a or b could be right, we've already eliminated c-e. Remember that the slope of the isoquant is the MRTS, or the ratio of the marginal products of the inputs, and the slope of the isocost line is the ratio of factor costs. But even if we don't remember that it should be clear that
