Copyright © 1995-2004 OnLineTexts.com, Inc. - All Rights Reserved

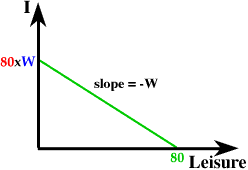
 The graph to the right shows the Income (I)/ Leisure choices available to an individual who has 80 hours per week to spend in work or leisure, and who earns a wage of W per hour. If all time is spent in Leisure, Income is zero, if all time is spent working Income is 80 x W. So, the green line is similar to a budget constraint.
The slope of the budget constraint is -W so it becomes steeper (more negatively sloped) as W increases. We can think of the wage, W, as the opportunity cost of leisure.
![]()

Copyright © 1995-2004 OnLineTexts.com, Inc. - All Rights Reserved