
9 Relationships where the slope changes sign are common, but the relationship shown to the right is not one of these.
Copyright © 1995-2004 OnLineTexts.com, Inc. - All Rights Reserved

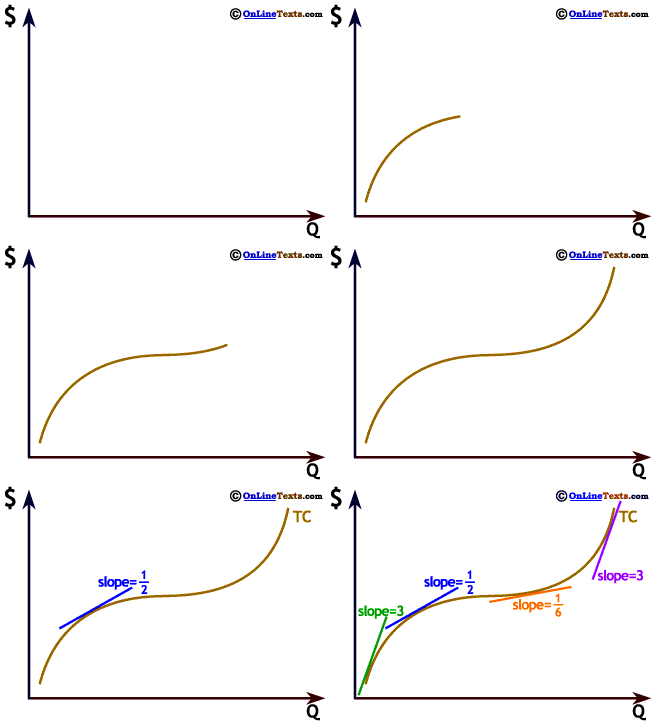
Nonlinear relationships can be more complex than the ones we've seen so far. To the right we show a positive, nonlinear relationship that starts out increasing at a decreasing rate, but at higher levels of Q the curvature changes and the relationship becomes one that is increasing at an increasing rate.
This is a Total Cost curve showing that cost increases as output, Q, increases but that the rate of increase depends on the amount of output. When Q is very low the slope is 3 but falling. The declining slope shows that cost is increasing at a decreasing rate. Toward the middle of the graph the curve "flattens out" and the slope becomes quite small, though never negative.9 As we move farther to the right the direction of curvature changes and the slope begins increasing again, showing that as Q continues to rise cost is increasing at an increasing rate.


9 Relationships where the slope changes sign are common, but the relationship shown to the right is not one of these.
Copyright © 1995-2004 OnLineTexts.com, Inc. - All Rights Reserved