

11 If we allow fractional values and/or negative numbers, there are an infinite number of points where A + B = 30.
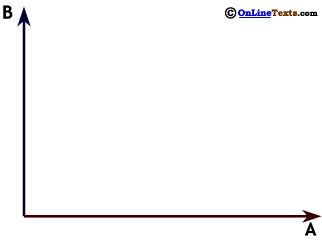
So far we've been looking at graphs of relationships between two variables. In these relationships, the value of one of the variables would be determined by the value of another. Sometimes we want to show all the possible values of two variables yielding a common value of some relationship. A simple example is shown in the diagram to the right where we consider the simple sum of two numbers. The value of A does not determine the value of B, instead, we've shown the set of all the (positive) values of A and B that add up to 30.
Points X and Y are two sets of values of A and B where A + B = 30.11 At point X the value of A is 9 and the value of B is 21 (9 + 21 = 30). At point Y the value of A is 24 and the value of B is 6 (24 + 6 = 30). The endpoints of the line work too. On the vertical axis the line crosses where B is 30 and A is zero (30 + 0 = 30), and on the horizontal axis A is 30 and B is zero (0 + 30 = 30).
11 If we allow fractional values and/or negative numbers, there are an infinite number of points where A + B = 30.