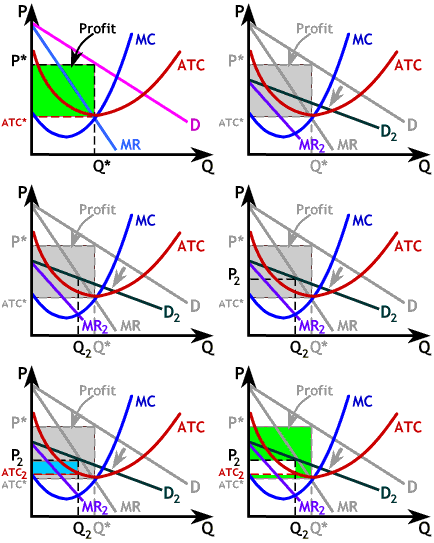
 The final green shaded area (shown separately directly to the right) is the amount of profit lost by this firm due to entry, and as such is an approximation of
the upper limit of what it could be expected to expend in the
erection of barriers, or to give up through limit pricing.


Copyright © 1995-2004 OnLineTexts.com, Inc. - All Rights Reserved
 Recall the graph to the right of the firm that faced entry.
Its profits were greatly reduced as a result.