
Copyright © 1995-2004 OnLineTexts.com, Inc. - All Rights Reserved

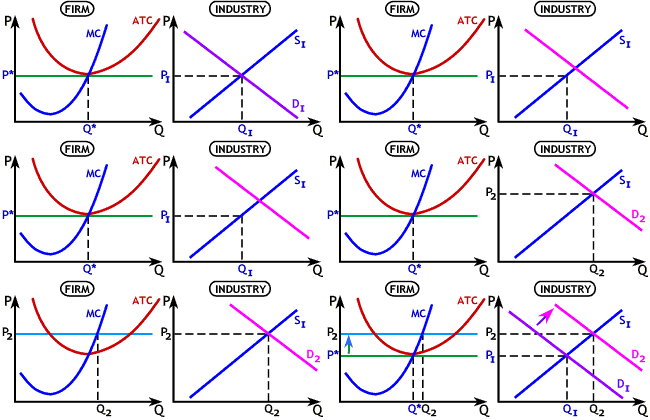
This graph shows an increase in demand for a good produced in a perfectly competitive industry. Whatever the specific event that caused demand to increase, the industry is no longer in equilibrium as a result of the change.
Demand has increased to D2, causing market price to increase to P2. Because price is higher, firms increase output to Q2. Since industry supply is just the sum of firm supply, industry
output increases as well to Q2 on the industry graph. All this takes place in the short run.


Copyright © 1995-2004 OnLineTexts.com, Inc. - All Rights Reserved