
Copyright © 1995-2004 OnLineTexts.com, Inc. - All Rights Reserved

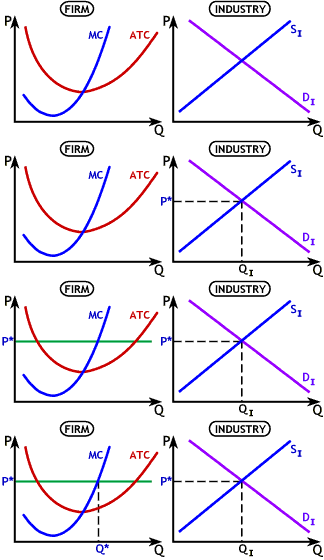
We will continue to use this two graph approach. The graph on the left is a graph of a typical firm in the industry. For simplicity, we assume that firms are identical in terms of cost curves. Therefore, all firms have identical graphs, since price is determined in the market.
The graph on the right illustrates the industry where DI it total market demand and SI is total industry supply.


Copyright © 1995-2004 OnLineTexts.com, Inc. - All Rights Reserved