Copyright © 1995-2004 OnLineTexts.com, Inc. - All Rights Reserved
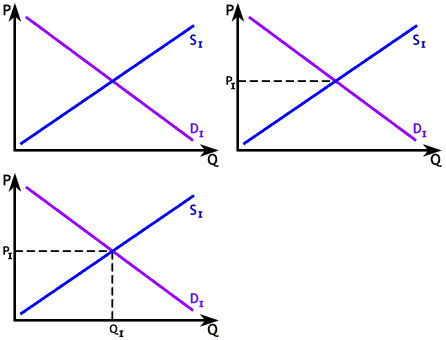
 The graph to the right is a simple demand and supply graph. Here we are using it to illustrate a perfectly competitive
industry in long run equilibrium in order to understand the long run supply behavior of such an industry.
Remember that we show movement along a supply curve by asking what happens when demand changes. We will consider shifts in demand and ask how the industry responds in the long run.
To a considerable extent we've already answered this question.
We have found that, in general, demand shifts lead to a change in the
number of firms but no change in long run market price.

Copyright © 1995-2004 OnLineTexts.com, Inc. - All Rights Reserved