Copyright © 1995-2004 OnLineTexts.com, Inc. - All Rights Reserved

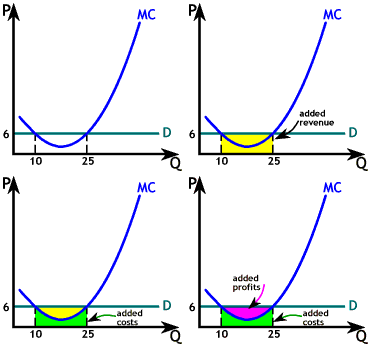
Here we show the added revenue (P x Q) of selling the 10th through the 25th unit as the yellow shaded area. Of that added revenue area, the green section below the marginal cost curve is the area of added costs. Since the added revenue of selling the 10th through the 25th unit is greater than the added costs, what remains is added profit. To calculate this added profit we subtract the added costs from the added revenue.
Therefore, by producing at the first quantity, 10, we would be forgoing profits equal to the purple area in the graph, which would not be profit maximizing.
Producing at 25 (Q2) will give us added profits.

Copyright © 1995-2004 OnLineTexts.com, Inc. - All Rights Reserved