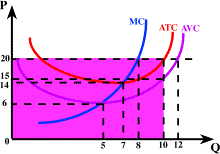
If the firm (whose cost data are shown in the above graph) is producing
10 units, what are its total costs? As we know, total cost is
just Q x ATC. On the graph at output of 10 units we just follow the dashed
line up from 10 to see how high the ATC curve is at that level of output. We find that at 10 units of
output ATC = 20, so total cost = 10 x 20 = 200. This is shown as the shaded area.
 10.Consider the profit maximizing perfectly competitive firm shown
in Figure 3. If this firm is producing an output of 10 units, it's total costs
will be:
- $150. At an output of 10 this is total variable costs.
- $20. At an output of 10 this is the average costs per unit.
- $15. At an output of 10 this is the variable costs per unit.
- $50. This is fixed cost for this firm.
- $200.
Next Question
Copyright © 1995-2004 OnLineTexts.com, Inc. - All Rights Reserved

