This question is simply a matter of reading the graph correctly.
The easiest approach, in a case such as this, is to simply consider
each answer choice carefully. First though, we've shaded some
of the defined areas on the graph to further illustrate:
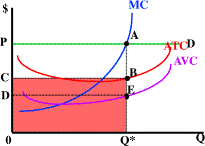 |
0CBQ* = Total Cost |
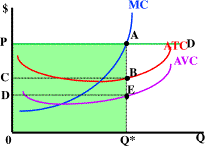 |
0PAQ* = Total Revenue |
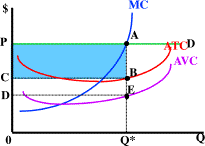 |
CPAB = Profit |
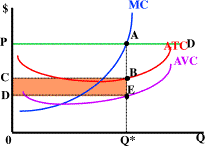 |
DCBE = Fixed Cost |
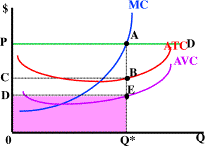 |
0DEQ* = Variable Cost |
4. If the profit maximizing firm shown in Figure 2 is producing Q* units of output, it is operating where:
- losses equal DCBE. The area defined by the points DCBE turns out to be fixed cost; fixed cost is the difference between total variable cost and total cost. Also, this firm is earning a profit; therefore, losses can't be correct.
- total variable costs equal area DPAE. The area defined by the points DPAE is profit + fixed cost, so this must be wrong.
- profits are at their maximum value and equal CPAB.
- total fixed costs are equal to area 0DEQ*. The area defined by the points 0DEQ* is total variable cost.
- profits are at their maximum value and equal DPAE. The area defined by the points DPAE is profit + fixed cost, so this must be wrong.
Next Question
Copyright © 1995-2004 OnLineTexts.com, Inc. - All Rights Reserved


