
Copyright © 1995-2004 OnLineTexts.com, Inc. - All Rights Reserved

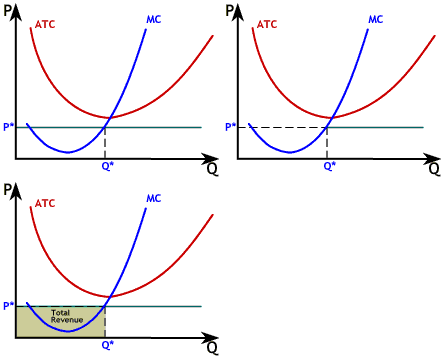
On the graph to the right, the firm is selling Q* units at the market price of P*. The total revenue from this sale is depicted as the shaded area, which is simply P* x Q*.
Unlike the firm we saw before, in this case market price, P*, is below Average Total Cost.


Copyright © 1995-2004 OnLineTexts.com, Inc. - All Rights Reserved