Sample Test Questions - 2 -

Sample Test Questions - 2 -


  1. Bill can purchase either apples, which cost $1.00, or books, which cost $5.00. With his weekly paycheck of $100, Bill currently buys 16 books and 20 apples. The ratio of Bill's marginal utility of books to apples is 10. The ratio of Bill's total utility of books to apples is 5. To maximize his utility, Bill should
    1. not alter his consumption pattern.
    2. consume more books and more apples.
    3. consume fewer books and more apples.
    4. consume more books and fewer apples.
    5. consume fewer books and fewer apples.

    Answer to Question 1

  2. The diamond-water paradox illustrates the important point that:
    1. the price of a good is closely related to its marginal rather than total utility.
    2. the price of a good is closely related to its total rather than marginal utility.
    3. water is a normal good.
    4. diamonds are an normal good.
    5. the demand for diamonds is elastic.

    Answer to Question 2


    Figure 1


  3. In Figure 1 above, if a consumer consumes bundle A, and the price of a slice of pizza is $2 and price of a coke is $1 then her income must be:
    1. $15
    2. $20
    3. $30
    4. $40
    5. $50

    Answer to Question 3

  4. If, in Figure 1, this same consumer chooses to spend all her income on pizza she can buy:
    1. 20 slices of pizza.
    2. 15 slices of pizza.
    3. 10 slices of pizza.
    4. 8 slices of pizza.
    5. 45 slices of pizza.

    Answer to Question 4

  5. must be met for a consumer to maximize utility?

    I. MUx = MU y

    II. P x = P y

    III. The slope of Budget line = slope of indifference Curve.

    IV.Consumption bundle must be on budget constraint.

    1. I
    2. I and II
    3. III
    4. III and IV
    5. I and IV

    Answer to Question 5


    Table 1
    Gross Utility for Tofu Burgers and Iced Tea
    Quantity Marginal Utility Marginal Utility
    from Tofu Burgers from Iced Tea
    4 60 15
    5 45 11
    6 33 9
    7 27 6
    8 18 5

  6. Professor Gross has only $23 per week to buy two goods, Tofu Burgers and Iced Tea. As he is well know around town as a deadbeat, he cannot get any credit, thus he must pay immediately for everything he consumes. Tofu Burgers costs $3 each and Iced Teas cost $1 each. If wants to maximize his utility he should consume:
    1. 4 Tofu Burgers and 11 Iced Teas.
    2. 6 Tofu Burgers and 5 Iced Teas.
    3. 5 Tofu Burgers and 8 Iced Teas.
    4. 8 Tofu Burgers and 3 Iced Teas.
    5. 7 Tofu Burgers and 6 Iced Teas.

    Answer to Question 6

  7. If Professor Grosses income goes up to $27, he will consume:
    1. 7 Tofu Burgers and 6 Iced Teas.
    2. 8 Tofu Burgers and 3 Iced Teas.
    3. 6 Tofu Burgers and 9 Iced Teas.
    4. 8 Tofu Burgers and 7 Iced Teas.
    5. 6 Tofu Burgers and 7 Iced Teas.

    Answer to Question 7


    Figure 2


  8. Al currently goes to 20 movies a year and buys 20 compact disks. His bugdet constraint and consumption bundle (E) are shown in Figure 2 above. Al learns that he will get a raise soon moving him to the higher budget constraint. If compact disks are a normal good, his consumption bundle for next year must lie between the points:
    1. C and D.
    2. B and D.
    3. A and B.
    4. A and C.
    5. B and C.

    Answer to Question 8

  9. Betty has the same income and consumption bundle as Al this year and is getting the same size raise. For Betty movies are an inferior good, thus her consumption for next year must lie between the points:
    1. C and D.
    2. B and D.
    3. A and B.
    4. A and C.
    5. B and C.

    Answer to Question 9


    Figure 3


  10. Figure 3 above shows the budget constraints for Charlie before and after the price of pizza fell as well as the information needed to decompose the change in demand into the income and substitution effect components. For Charlie the change in demand due to the substitution effect is equal to:
    1. PN - PS
    2. PS
    3. PN - PO
    4. PN
    5. PS - PO

    Answer to Question 10

  11. Again consider Charlie's budgets in Figure 3. From this we know that the change in demand due to the income effect is:
    1. PS - PO, and thus pizza is a normal good.
    2. PN - PS, and thus pizza is a normal good.
    3. PS, and thus pizza is an inferior good.
    4. PN- PS, and thus pizza is an inferior good.
    5. PN, and thus pizza is a normal good.

    Answer to Question 11

  12. The dashed line in Figure 3 represents:
    1. Charlie's indifference curve for Pizza and Soda.
    2. The compensated budget constraint Charlie would face if we took away income equal to the income effect that results from a decrease in the price of pizza.
    3. Charlie's original budget constraint.
    4. The compensated budget constraint Charlie would face if we took away income equal to the substitution effect that results from a decrease in the price of pizza.
    5. Charlie's ordinary new budget constraint after the price of pizza fell.
    Answer to Question 12

  13. When drawing a graph such as the one in Figure 3 we know that PS must lie to the right of PO because:
    1. as price rises, for a good such as pizza, more is always purchased.
    2. as price falls, for a good such as pizza, less is always purchased.
    3. bundles to the left of PO were available before the price changed but were not chosen.
    4. The income effect for an inferior good always works in the same direction as the substitution effect.
    5. The income effect for a normal good always works in the opposite direction as the substitution effect.
    Answer to Question 13


    Figure 4


  14. The graph in Figure 4 depicts a market in which an excise tax has been placed on some good. The amount of the tax per unit borne by producers is equal to:
    1. P3 - P1.
    2. P1 - P2.
    3. P3 - P2.
    4. 0.
    5. P1 + P2.

    Answer to Question 14

  15. The amount of revenue collected by the government from the tax shown in Figure 4 is equal to:
    1. area A + area C.
    2. area A + area B.
    3. area C + area D.
    4. area B + area D.
    5. area F.

      Answer to Question 15

  16. The total dead weight loss due to the tax in Figure 4 is equal to:
    1. area A.
    2. area A + area B.
    3. area C + area D.
    4. area B.
    5. area E - area F.

      Answer to Question 16

  17. In Figure 4 the total loss in consumer's surplus is equal to:
    1. area A + area C.
    2. area A + area B.
    3. area C.
    4. area B + area D.
    5. area E + area F.

      Answer to Question 17

  18. All else being equal, the excess burden or deadweight loss due to the imposition of a tax will be smaller when:
    1. the item being taxed has many close substitutes.
    2. demand or supply is very elastic so that the change in equilibrium quantity due to the tax is large.
    3. demand or supply is very elastic so that the change in equilibrium quantity due to the tax is small.
    4. demand or supply is very inelastic so that the change in equilibrium quantity due to the tax is large.
    5. demand or supply is very inelastic so that the change in equilibrium quantity due to the tax is small.
      Answer to Question 18


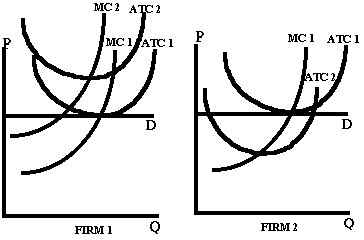
    Figure 5

  19. Consider Firm 1 whose cost and demand data are graphed in Figure 5. A possible explanation for the movement from MC1 and ATC1 to MC2 and ATC2 is:
    1. an increase in consumer demand for the product which is an inferior good.
    2. an increase in the cost of the raw materials used in production of the good.
    3. an increase in annual insurance premiums paid by the firm.
    4. a decrease in annual rent paid on the building used by the firm.
    5. a decrease in the wages of workers in this firm.
    Answer to Question 19

  20. Consider Firm 2 whose cost and demand data are graphed in Figure 5. A possible explanation for the movement from ATC1 to ATC2 is:
    1. an increase in consumer demand for the product which is an inferior good.
    2. an increase in the cost of the raw materials used in production of the good.
    3. an increase in annual insurance premiums paid by the firm.
    4. a decrease in annual rent paid on the building used by the firm.
    5. a decrease in the wages of workers in this firm.
    Answer to Question 20

  21. In the short run, for a firm such as Firm 1 depicted in Figure 5 you would expect that due to the change from MC1 and ATC1 to MC2 and ATC2 the firm will:
    1. maintain the same level of output.
    2. increase its output.
    3. decrease its output.
    4. shift the curves back to their original positions.
    5. shift its demand curve up.
    Answer to Question 21

  22. In the short run, for a firm such Firm 2 depicted in Figure 5 you would expect that due to the change from ATC1 to ATC2 the firm will:
    1. maintain the same level of output.
    2. increase its output.
    3. decrease its output.
    4. shift the curves back to their original positions.
    5. shift its demand curve up.
      Table 2
      GROSS GENERALIZATIONS
      Generalizations Produced Total Cost
      0 25.00
      1 35.00
      2 50.00
      3 70.00
      4 95.00
      5 125.00
      6 160.00
      7 200.00
    Answer to Question 22

  23. Gross Generalizations is a perfectly competitive firm. If the market price of generalizations is $32, how many will Gross produce?
    1. 5 generalizations.
    2. 4 generalizations.
    3. 3 generalizations.
    4. 6 generalizations.
    5. 7 generalizations.
    Answer to Question 23

  24. What is the range of prices for generalizations that will induce Gross to produce 6 generalizations?
    1. between $26.66 and $33.33.
    2. between $26.66 and $28.57.
    3. between $160 and $200.
    4. between $35 and $40.
    5. between $28.75 and $33.33
    Answer to Question 24

  25. Consider A's Antennas, a firm that manufactures cordless telephone antennas. When A's is producing 1000 antennas per day its total cost is $500 and its fixed cost is $100. At this level of output the average variable cost will be.
    1. $0.50.
    2. $0.60.
    3. $0.40.
    4. $0.41.
    5. $0.10.
    Answer to Question 25

  26. If A's annual rent for the building they are located in goes up by $3650, so that their rent is increased by $10 per day the firms average variable cost when they produce 1000 antennas will be.
    1. $0.51.
    2. $0.61.
    3. $0.40.
    4. $0.41.
    5. $0.10.
    Table 3
    Data For April Showers Inc.
    Umbrellas Produced Total Cost
    0 10.00
    1 15.00
    2 24.00
    3 39.00
    4 60.00
    5 85.00
    Answer to Question 26

  27. The total fixed cost of producing 3 umbrellas at April Showers Inc. is:
    1. $39
    2. $13
    3. $5
    4. $10
    5. $15
    Answer to Question 27

  28. The marginal cost of producing the 4th umbrella is:
    1. $60
    2. $39
    3. $20
    4. $21
    5. $15
    Answer to Question 28

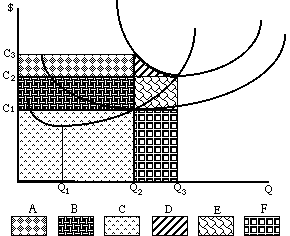
    Figure 6


  29. (production costs) When the firm depicted above in Figure 6 is producing the level of output at which average variable cost is at a minimum, total cost is denoted by:
    1. areas A + B +D + E.
    2. areas A + B + C.
    3. areas D + E + F.
    4. areas E + F.
    5. area C.
    Answer to Question 29

  30. When the firm depicted in Figure 6 produces output Q2, the total variable cost is denoted by:
    1. areas A + B + D + E.
    2. areas A + B + C.
    3. areas D + E + F.
    4. areas E + F.
    5. area C.
    Answer to Question 30

  31. When the firm depicted in Figure 6 produces output Q3, the total fixed cost is denoted by:
    1. areas A + B.
    2. areas A + B + C.
    3. areas D + E + F.
    4. areas E + F.
    5. area C.
    Answer to Question 31

    The following information is needed for the next 3 questions: A profit maximizing perfectly competitive firm is observed producing 800 books per day when the market price of books is $15.00. The total cost of producing 800 books per day is $4000.00. The firm's total fixed costs average to $1000.00 per day

  32. The marginal costs of producing the 800th book must be:
    1. $5.00
    2. $10.00
    3. $15.00.
    4. $100.00
    5. $4000.00
    Answer to Question 32

  33. When the firm produces 800 books its average variable costs must be:
    1. $3.75.
    2. $4.00
    3. $1.25
    4. $15.00
    5. $3000.00
    Answer to Question 33

  34. When the firm produces 800 books its average fixed costs must be:
    1. $3.75
    2. $4.00
    3. $1.25.
    4. $15.00
    5. $1000.00
    Answer to Question 34

    Table 4
    Joe's Utility for Novels per Month
    Number of Novels Total Utility in $
    0 $0
    1 $3
    2 $7
    3 $12
    4 $16
    5 $19
    6 $21
    7 $22

  35. Table 1 above gives Joe's Total utility for novels from 0 to 7 books. At what point does Joe begin to experience diminishing marginal utility from increasing book consumption?
    1. Between 3 and 4 books.
    2. Between 4 and 5 books.
    3. Between 1 and 2 books.
    4. Between 2 and 3 books.
    5. Between 5 and 6 books.
    Answer to Question 35

  36. Suppose we observe that Joe purchases 4 novels per month. What is the range of prices which would lead Joe to purchase this number of novels?
    1. between $3.80 and $4 per book.
    2. between $2 and $3 per book.
    3. between $3 and $4 per book.
    4. between $4 and $5 per book.
    5. between $16 and $19 per book.
    Answer to Question 36

  37. When we speak of the ``income effect'' we mean that:
    1. as income rises consumers purchase more normal goods.
    2. as income rises consumers purchase more luxury goods.
    3. as the price of a good falls it is like getting more income.
    4. as income falls consmers purchase more inferior goods.
    5. as we purchase less of any good we experience diminishing marginal utility.
    Answer to Question 37

    Table 5
    Fred's Marginal Utility for Brats and Beer
    Quantity MU of Brat MU of Beer
    1 16 11
    2 14 10
    3 12 9
    4 10 8
    5 8 7
    6 6 6
    7 4 5
    8 2 4

  38. Consider the information shown for Fred in Table 5. He spends all of his daily income of $12 on brats and beer. (Fred must live in Milwaukee.) (If you're not from Wisconsin you may not realize that in this instance brats refer to bratwursts, not kids). Brats cost $2 each, beers costs $1 each. Fred's optimal consumption bundle will be:
    1. 5 brats and 2 beers.
    2. 2 brats and 8 beers.
    3. 5 brat and 1 beer.
    4. 3 brats and 6 beers.
    5. 4 brats and 4 beers. Answer to Question 38

  39. Again consider the information shown for Fred in Table 5. Suppose the price of beer increases to $2 but his daily income remains at $12. Fred's new optimal consumption bundle will be:
    1. 3 brats and 3 beers.
    2. 2 brats and 4 beers.
    3. 4 brats and 2 beers.
    4. 5 brats and 1 beer.
    5. 1 brat and 5 beers.
    Answer to Question 39

  40. Again consider the information shown for Fred in Table 5. In order to compensate Fred for the income effect of the increase in the price of beer we need to increase his daily income by:
    1. $2.
    2. $3.
    3. $4.
    4. $5.
    5. $6.
    Answer to Question 40

  41. Again consider the information shown for Fred in Table 5. If we compensate Fred by the amount in the previous questions, his new consumption of Beer and brats will be:
    1. 6 brats and 3 beers.
    2. 3 brats and 5 beers.
    3. 4 brats and 4 beers.
    4. 4 brats and 5 beers.
    5. 5 brats and 4 beers.
    Answer to Question 41

  42. Again consider the information shown for Fred in Table 5. When the price of beer rose, Fred's consumption of beer changed by how much due to the substitution effect?
    1. there was no change.
    2. it fell by 1 beer.
    3. it fell by 2 beers.
    4. it fell by 3 beers.
    5. it rose by 1 beer.
    Answer to Question 42

    Figure 7


  43. In the long run, the perfectly competitive firm depicted in Figure 7 will produce at point:
    1. A
    2. B
    3. C
    4. D
    5. E
    Answer to Question 43

  44. If the firm shown in Figure 7 faces a price of Po, in the short run its optimal choice will be to:
    1. break even.
    2. operate at a loss
    3. earn positive profit.
    4. shut down.
    5. cover all its costs, fixed and variable.
    Answer to Question 44


    Figure 8


  45. If the firm depicted in Figure 8 is behaving as a perfect competitor and market price is P1 the it should.
    1. produce Q1 because at that level of output price equals marginal cost.
    2. produce Q2 because at that level of output it covers all variable costs.
    3. produce Q 3 because at that level of output it covers total costs.
    4. produce Q 4 because at that level of output it minimizes its average variable cost.
    5. produce Q 5 because at that level of output price equals marginal cost.
    Answer to Question 45

    Table 6
    DATA FOR DODADS INC.
    Number of Dodads produced
    Workers Per Hour
    1 8
    2 16
    3 23
    4 29
    5 34
    6 38
    7 41
    8 43
    9 44

  46. If Dodads Inc, whose data is shown in Table 6, is a perfectly competitive firm and dodads sell for $5 each how many workers will it hire if the wage rate is $16 per hour and there are no other variable costs for producing Dodads.
    1. 3 workers.
    2. 4 workers
    3. 5 workers.
    4. 6 workers.
    5. 7 workers.
    Answer to Question 46

  47. If Dodads Inc, whose data is shown in Table 6, is a perfectly competitive firm and if the price of dodads goes up to $6 each how many workers will it hire if the wage rate is still $16 per hour.
    1. 3 workers.
    2. 4 workers
    3. 5 workers.
    4. 6 workers.
    5. 7 workers.
    Answer to Question 47

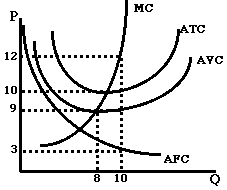
    Figure 9

  48. Consider the perfectly competitive firm represented by Figure 9. When the equilibrium price is 12 the firm's total variable cost is:
    1. 30
    2. 90
    3. 40
    4. 100
    5. 120
    Answer to Question 48

  49. Again consider the firm in Figure 9. When the equilibrium price is 12 the firm earns economic profits of:
    1. - 20
    2. 20
    3. - 70
    4. 30
    5. 120
    Answer to Question 49

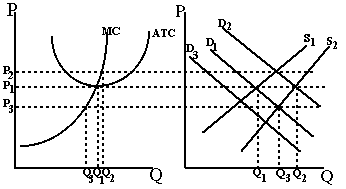
    Figure 10

  50. Consider the perfectly competitive firm and industry depicted in Figure 10. The industry was in long run equilibrium when demand for the good it produces increased causing the demand curve to shift from D1 to D2. In the short run:
    1. There is no change in the output for the firm or the industry.
    2. Price and quantity produced increase for the firm and industry.
    3. Output increases for the firm but falls for the industry.
    4. Price decreases for the firm, but increase for the industry.
    5. Price stays the same for the firm, but quantity decreases.
    Answer to Question 50

  51. Again refer to Figure 10. Over time the supply curve shifts to S2. This is due to:
    1. An increase in the cost of an input.
    2. Firms leaving the industry due to the fact that firms were operating at a loss.
    3. Firms leaving the industry due to the fact that firms were earning positive economic profits.
    4. Firms entering the industry due to the fact that firms were earning positive economic profits.
    5. Firms entering the industry due to the fact that firms were operating at a loss.
    Answer to Question 51

  52. Again referring to Figure 10, the new long run equilibrium will differ with the original long run equilibrium in that:
    1. The firm and the industry will produce at the same level as before.
    2. The firm and the industry will produce more at a higher price.
    3. The firm and the industry will produce less at a lower price.
    4. The firm will produce at the same level at the original price while the industry will produce more at the original price.
    5. The firm will produce less at the original price, while the industry will produce more at the original price.
    Answer to Question 52

© 1995-1998 EconWeb - All Rights Reserved