Sample Test Questions - 4 -

Sample Test Questions - 4 -


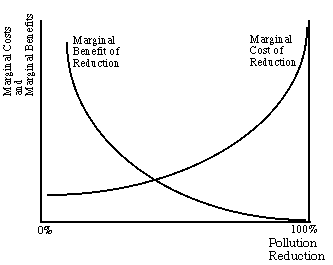
    Figure 1

  1. In Figure 1 we show some relevant information on pollution reduction. The socially efficient amount of pollution reduction is:
    1. the amount at which average benefit is equal to average cost.
    2. 100 percent, since that maximizes the gains from pollution control.
    3. zero, since pollution controls reduce profits.
    4. the amount at which the marginal benefits equal the marginal costs.
    5. indeterminate without additional information about the type of pollution.

    Answer to Question 1

  2. Referring to Figure 1, new findings indicating that the adverse health effects or other damages from this pollution are greater than previously thought will:
    1. shift the marginal cost curve rightward, increasing the optimal level of pollution control.
    2. shift the marginal benefit curve leftward, decreasing the optimal level of pollution control.
    3. shift both the marginal benefit curve and the marginal cost curve rightward, increasing the optimal level of pollution control.
    4. shift the marginal benefit curve rightward, increasing the optimal level of pollution control.
    5. shift both the marginal benefit curve and the marginal cost curve leftward, decreasing the optimal level of pollution control.
    Answer to Question 2

  3. Again referring to Figure 1, other things being equal, an improvement in pollution control or reduction technology will:
    1. shifts the marginal cost curve rightward, increasing the optimal level of pollution control.
    2. shifts the marginal cost curve leftward, decreasing the optimal level of pollution control.
    3. shifts both the marginal benefit curve and the marginal cost curve rightward, increasing the optimal level of pollution control.
    4. shifts the marginal benefit curve rightward, increasing the optimal level of pollution control.
    5. shifts both the marginal benefit curve and the marginal cost curve leftward, decreasing the optimal level of pollution control.

    Answer to Question 3

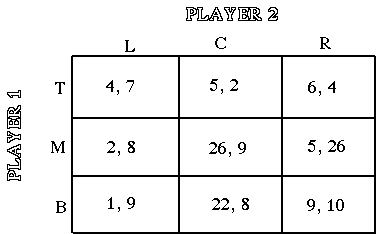
    Figure 2

  4. In the payoff matrix given in Figure 2 the first number in each cell represents (as usual) the payoff to player 1, the second number in each cell is the payoff to player 2. Which of the following are Nash equilibria, in pure strategies, for this game?
    1. TL, BR
    2. MC, BR
    3. ML, TR
    4. TR, MR, BC
    5. There are no pure strategy Nash equilibria.

    Answer to Question 4

  5. Again considering the payoff matrix in Figure 2, which of the following are dominant strategies?
    1. M for 1, R for 2
    2. M for 1, L for 2
    3. B for 1, no dominant strategies for 2
    4. R for 2, no dominant strategies for 1
    5. There are no dominant strategies.

    Answer to Question 5

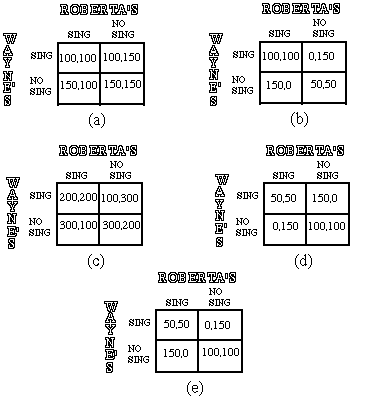
  6. Wayne's Waste Removal and Roberta's Recycling are two trash collection firms operating in a small community. The latest craze in trash collection is Tuxedo-clad singing garbage collectors. At present, Wayne and Roberta share the market for Trash collecting services, each have revenues of $200,000 per week and economic costs of $100,000 per week. Hiring singing garbage collectors increases economic costs to $150,000 per week. If both hire singing garbage collectors their revenues will remain the same. If only one of them employs the singers, however, their revenues will increase to $300,000, while his or her competitor's will fall to $100,000. If we express payoffs as profits (in thousands) which of the following payoff matrices represents the game faced by the two garbage collectors:
    Answer to Question 6

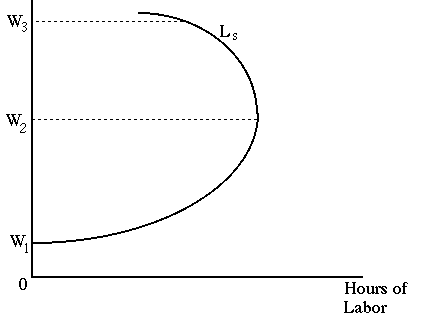
    Figure 3

  7. Figure 3 shows a labor supply curve for some individual. Which of the following is true for this individual?
    1. from 0 to W1 the income effect of a wage increase dominates the substitution effect.
    2. from W2 to W3 the substitution effect of a wage increase dominates the income effect.
    3. at wages below W2, there is no substitution effect from a wage increase .
    4. from W1 to W2 the substitution effect of a wage increase dominates the income effect.
    5. from W1 to W2the income effect of a wage increase dominates the substitution effect.

    Answer to Question 7

  8. Suppose workers in a particular firm join a company health program, cut down on smoking and drinking, and get more exercise. Further suppose this significantly increases their productivity. If the firm hires workers in a competitive labor market and behaves as a profit maximizer it will respond by:
    1. laying off workers since it takes fewer workers to produce the same amount of output.
    2. hiring more workers since increased productivity is equivalent to reduced production costs.
    3. laying off workers since it will now need more capital to go with the healthier workers.
    4. keep employment the same and enjoy greater profits.
    5. it all depends on the supply elasticity of labor's marginal demand.
    Answer to Question 8

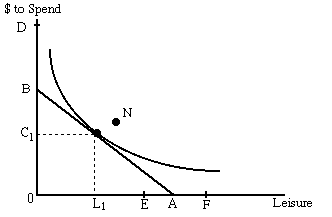
    Figure 4

  9. Figure 4 illustrates the money/leisure trade-offs available to some individual as well as her current indifference curve. We can represent an increase in the wages of this individual by:
    1. shifting the budget line to the right.
    2. drawing a new budget line from points E to D.
    3. drawing a new budget line from points A to D.
    4. drawing a new budget line from points B to F.
    5. shifting the isoquants schedule away from the origin.

    Answer to Question 9

  10. Again considering Figure 4, after the increase in the wage we observe her new consumption of goods and leisure to be represented by the point N. This suggests that:
    1. she is being paid too much.
    2. the opportunity cost of leisure has fallen for her.
    3. consumer goods are inferior goods for her.
    4. she is on the backward bending portion of her labor supply curve.
    5. the income effect of her wage increase is dominated by the substitution effect.

    Answer to Question 10

  11. Suppose that the market supply relationship is given by QS = 2P - 4 and the market demand relationship is given by QD = 20 - 2P. If the current price is $4 then for this market there will be:
    1. surplus and price will increase.
    2. shortage and price will decrease.
    3. surplus and price will decrease.
    4. shortage and price will increase.
    5. no surplus or shortage as this is the equilibrium price.
    Answer to Question 11

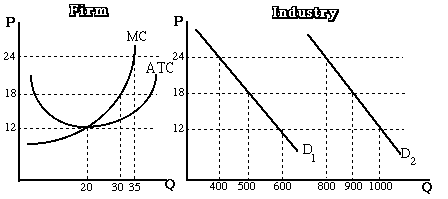
    Figure 5

  12. Figure 5 shows the cost curves for a firm in a competitive industry and the total industry demand at several prices. Each firm in the industry has exactly the same cost curves as the one depicted above. The market demand curve is initially given by D1. If the market is in long-run equilibrium what is the equilibrium price and quantity for each individual firm?
    1. Price = 12 and Quantity = 20
    2. Price = 18 and Quantity = 30
    3. Price = 24 and Quantity = 35
    4. Price is below 12 and Quantity is below 20
    5. Price is above 24 and Quantity is above 35.

    Answer to Question 12

  13. In the long run equilibrium in Figure 5, where industry demand is at D1, what will be the long run equilibrium number of firms?
    1. 20.
    2. 25.
    3. 30.
    4. 35.
    5. 40.

    Answer to Question 13

  14. Referring again to Figure 5, suppose industry demand shifts from D1 to D2. What will the short run equilibrium price and quantity be for each individual firm after the shift?
    1. Price = 12 and Quantity = 20
    2. Price = 18 and Quantity = 30
    3. Price = 24 and Quantity = 35
    4. Price is below 12 and Quantity is below 20
    5. Price is above 24 and Quantity is above 35.

    Answer to Question 14

  15. Referring once more to Figure 5, in the long run, after the shift to D2, what will the long run equilibrium number of firms be?
    1. 20.
    2. 30.
    3. 40.
    4. 50.
    5. 60.

    Answer to Question 15

    The next 3 questions concern a market for which the demand function is given by Q = 90 - 10P. You may find it helpful to sketch graphs.

  16. Assume the initial market price is P = $6 per unit. What is the consumer surplus?
    1. 30
    2. 45
    3. 50
    4. 65
    5. 90

    Answer to Question 16

  17. Suppose the price changes to $3 per unit. What is the change in consumer surplus?
    1. 105
    2. 115
    3. 125
    4. 135
    5. 180

    Answer to Question 17

  18. Suppose the supply curve is perfectly horizontal at P = 3, What is the total consumers' plus producers' surplus?
    1. 90
    2. 180
    3. 270
    4. 360
    5. 405

    Answer to Question 18

  19. Suppose simultaneously there is an increase in the price of gasoline and an improvement in automobile production technology. Based on these two changes we expect that to observe which changes in equilibrium price and quantity of automobiles:
    1. higher quantity, lower price.
    2. lower quantity, lower price.
    3. indeterminate change in quantity, but higher price.
    4. indeterminate change in quantity, but lower price.
    5. higher quantity, but indeterminate change in price.
    Answer to Question 19

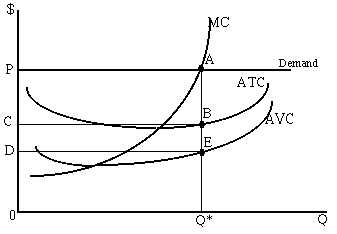
    Figure 6

  20. If the firm shown in Figure 6 is producing Q* units of output, it is operating where:
    1. losses equal DCBE.
    2. total variable costs equal area DPAE.
    3. profits are at their maximum value and equal CPAB.
    4. economic inefficiency occurs because price exceeds average cost.
    5. profit is zero.

    Answer to Question 20

  21. Total fixed cost for the firm shown in Figure 6 is given by:
    1. CPAB.
    2. DCBE.
    3. 0PAQ*.
    4. DPAE.
    5. DPBE.

    Answer to Question 21

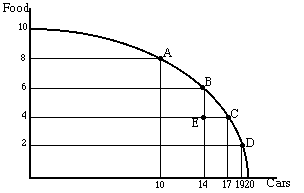
    Figure 7

  22. Consider Figure 7. If we find ourselves at point C and wish to increase food output by 2 more units what is the opportunity cost of this increase in terms of cars:
    1. 2.
    2. 3.
    3. 10.
    4. 14.
    5. 17.

    Answer to Question 22

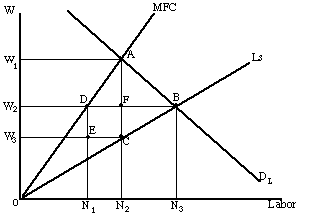
    Figure 8

  23. If the firm depicted in Figure 8 acts as a profit maximizer it will find the following labor, wage combination is optimal:
    1. Wage = W2 and Labor = N3
    2. Wage = W1 and Labor = N2
    3. Wage = W3 and Labor = N3
    4. Wage = W3 and Labor = N2
    5. Wage = W2 and Labor = N1

    Answer to Question 23

  24. Because the firm depicted in Figure 8 is the only employer of this type of labor, a deadweight loss is created. In this case the amount of that deadweight loss is:
    1. W1 A F W2.
    2. A C B.
    3. A F B.
    4. W2 B C W3.
    5. W1 A B W2.

    Answer to Question 24

  25. Again referring to Figure 8, if a new law raising the minimum wage to W2 is passed, this firm's new labor supply curve becomes:
    1. W2 B LS
    2. W2 D A
    3. W3 E C B LS
    4. 0 D F A MFC.
    5. W3 E D F B LS .

    Answer to Question 25

  26. Once more referring to Figure 8, if the firm faces a minimum wage of W2 it will :
    1. Reduce hiring to N1 and keep the wage at W3
    2. Increase hiring to N3 and increase the wage to W2
    3. Increase hiring to N3and keep the wage at W1
    4. Reduce hiring to N3 and reduce the wage to W3
    5. Increase hiring to N2 and increase the wage to W2

    Answer to Question 26

  27. Collusion
    1. is always the same as setting price equal to marginal revenue.
    2. is explicitly made legal by the Sherman Antitrust Act.
    3. permits firms to achieve allocative efficiency.
    4. enables firms to agree on reduced output.
    5. pushes out the production possibilities frontier.

    Answer to Question 27

  28. If a piece of farm land can earn rental payments for it's owner of $10,000 per year forever, and the interest rate is expected to remain at 10%, and there is no unexpected inflation or risk you expect the price of the land to be:
    1. $10,000/1.1.
    2. an infinite amount since it will yield an infinite stream of payments.
    3. to increase when the price of farm products falls.
    4. $100,000.
    5. $10,000/(1.119).

    Answer to Question 28

    Figure 10

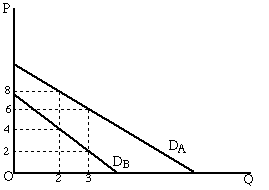
  29. Suppose only 2 people live in Walkerville. Figure 10 shows their demands for some public good. If Walkerville decides to produce 3 units of the good and this is an economically efficient amount, then the marginal cost of producing the last unit should be:
    1. $8.
    2. $4.
    3. $12.
    4. $6.
    5. $2.

    Answer to Question 29

  30. Again consider the demands for a public good shown in Figure 10. If a change in production costs convinces the government to reduce optimal production from 3 to 2 units then the marginal cost of the last unit of the public good produced could be:
    1. between $6 and $4.01.
    2. between $4 and $2.01.
    3. between $14 and $8.01.
    4. between $3 and $2.01.
    5. between $12 and $8.01.

    Answer to Question 30

  31. Suppose that you open your own business and receive an accounting profit of $30,000 per year. When you started your business, you left a job that paid you a $25,000 salary annually. Also suppose that you invest $70,000 of your own money to start up your own business, which can be recovered if the business fails. If the normal rate of return on capital is 10% your economic profit is:
    1. -$65,000
    2. -$2,000
    3. +$5,000
    4. +$48,000
    5. +$30,000

    Answer to Question 31

  32. Suppose a firm uses 10 hours of labor and 5 units of capital to produce 100 units of output. The firm expands over time until it uses 12 hours of labor and 6 units of capital to produce 120 units of output. Production for this firm is characterized by:
    1. increasing returns to scale.
    2. decreasing returns to scale.
    3. constant returns to scale.
    4. diseconomies of scale.
    5. law of diminishing returns.

    Answer to Question 32

    Table 1
    Income Quantity Demanded of X Quantity Demanded of Y Quantity Demanded of Z
    1000 125 70 4
    2000 200 55 9

  33. Based on the information given in the table above we know that.
    1. good X is inferior, good Y is normal, and good Z is inferior.
    2. good X is normal, good Y is inferior, and good Z is normal.
    3. good X is normal, good Y is normal, and good Z is inferior.
    4. good X is inferior, good Y is normal, and good Z is normal.
    5. good X is inferior, good Y is inferior, and good Z is normal.

    Answer to Question 33

  34. Based on the information given in the table above we also know that.
    1. good X is an necessity and good Y is a luxury.
    2. good Y is an necessity and good Z is a luxury.
    3. good Z is an necessity and good X is a luxury.
    4. good X is an necessity and good Z is a luxury.
    5. good Z is an necessity and good Y is a luxury.

    Answer to Question 34

  35. Suppose a firm which makes widgets hires labor in a perfectly competitive factor market. Which of the following is most likely to lead to an increase in the number of workers hired, but no increase in the wage paid.
    1. A decrease in the price of a good that is a substitute for widgets.
    2. An increase in the price of a good that is a complement for widgets.
    3. A decrease in consumer's incomes if widgets are an inferior good.
    4. A change in consumer's expectations leading them to believe that the price of widgets will fall in the future.
    5. Any change in the demand for the product of a firm that hires labor in competitive factor markets will lead to a change both in numbers employed and in the wage.
    Answer to Question 35

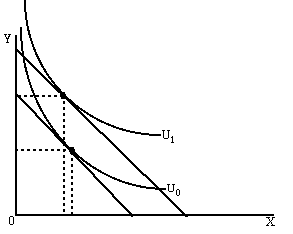
    Figure 11

  36. Figure 11 gives two indifference curves and two budget constraints for a single individual. Due to a loss in income the individual moves from indifference curve U1 to U0. From this we know that:
    1. X is an inferior good and Y is an inferior good.
    2. X is a normal good and Y is an normal good.
    3. X is a luxury good and Y is a normal good.
    4. X is an inferior good and Y is a normal good.
    5. X is a luxury good and Y is an inferior good.

    Answer to Question 36
    Table 2
    Workers Total Output per Week
    1 100
    2 250
    3 350
    4 425
    5 475
    6 500
    7 510

  37. Table 3 gives data for a firm which pays $500 per week for each worker and sells its output for $10 per unit. The marginal revenue product of the third worker for the firm is
    1. $100.
    2. $1,000.
    3. $250.
    4. $700.
    5. $350.

    Answer to Question 37

  38. Again referring to the firm from the previous question, what is the profit maximizing level of output per week?
    1. 425.
    2. 500.
    3. 350.
    4. 475.
    5. 250.

    Answer to Question 38

  39. Which of the following will lead to an inelastic demand curve for labor:
    1. the firm produces a product with many close substitutes.
    2. a production process in which it is easy to substitute capital for labor.
    3. a production process in which labor costs are a small fraction of total costs.
    4. a production process in which adding more labor causes marginal product to fall only slightly.
    5. a production process in which it is easy to substitute labor for capital.
    Answer to Question 39

  40. Suppose silk and cotton socks are considered substitutes. Suppose the price of silk socks rises. At the same time suppose that a report linking poor health to working conditions in cotton sock factories is made public. What will happen in the market for cotton sock workers.
    1. Wages of cotton sock workers will increase, and the number hired will increase.
    2. Wages of cotton sock workers will increase but the change in the number hired will be indeterminate.
    3. Change in the wages of cotton sock workers will be indeterminate but the number hired will fall.
    4. Wages of cotton sock workers will fall, and the number hired will increase.
    5. Change in the wages of cotton sock workers will be indeterminate but the number hired will increase.
    Answer to Question 40

  41. Suppose potato chips are an inferior good. Suppose filling bags of potato chips is a skilled job which requires considerable training, thus the supply curve of potato chip bag stuffers is upward sloping. A general decrease in consumer incomes would result in which of the following?
    1. An increase in the number of potato chip bag stuffers hired and an increase in wages paid to potato chip stuffers.
    2. An increase in the number of potato chip bag stuffers hired and a decrease in wages paid to potato chip stuffers.
    3. No change in the number of potato chip bag stuffers hired and a decrease in wages paid to potato chip stuffers.
    4. A decrease in the number of potato chip bag stuffers hired and an increase in wages paid to potato chip stuffers.
    5. A decrease in the number of potato chip bag stuffers hired and a decrease in wages paid to potato chip stuffers.

    Answer to Question 41

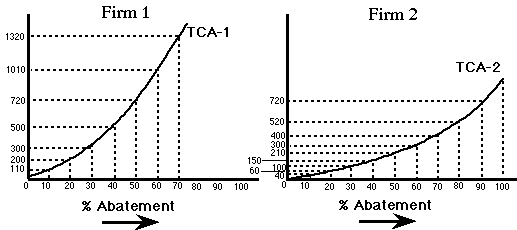
    Figure 12

  42. Figure 12 shows Total Costs of pollution abatement for a specific air-borne pollutant for two firms in the same airshed. Suppose that both firms, if they engage in no abatement, emit identical amounts of the pollutant. (Notice that these are total abatement cost curves, not marginal abatement cost curves such as the ones we drew in class.) Suppose the EPA mandates that pollution be reduced by 50%. If this is done by each firm reducing its current pollution by 50% the total cost of achieving this reduction will be:
    1. 700
    2. 2060
    3. 510
    4. 720
    5. 930
    Answer to Question 42

  43. (externalities) Again referring to the two firms in Figure 12, the marginal cost of the last 10% of pollution removed (that is think of 10% as a unit of pollution) for each firm if each reduces pollution by 50% is:
    1. 720 for Firm 1, 210 for Firm 2
    2. 144 for Firm 1, 42 for Firm 2
    3. 220 for Firm 1, 60 for Firm 2
    4. 1220 for Firm 1, 360 for Firm 2
    5. 122 for Firm 1, 36 for Firm 2
    Answer to Question 43

  44. Again considering Figure 12, suppose the firms are allowed to buy and sell pollution rights with each other but only in 10% blocks. Suppose they continue buying and selling as long as any incentive for trades exists. If this is done, the reduction in total cost of reducing pollution by 50% compared to the first plan for this airshed will be:
    1. 230
    2. 130
    3. 600
    4. 110
    5. 400
    Answer to Question 44

  45. One important difficulty with minimum wage laws when applied in competitive factor markets is that in most such cases:
    1. they force employers to hire workers at wages higher than their marginal physical product.
    2. they force employers to hire workers at wages higher than their marginal revenue product.
    3. they always force employers to hire workers at wages below their marginal product.
    4. when they are effective, they reduce employment.
    5. they artificially reduce the hiring costs of the firm.

    Answer to Question 45
© 1995-1998 EconWeb - All Rights Reserved