Chapter Six: Lecture Notes -- Unemployment
- Measuring Unemployment
- Criticisms of the Unemployment Rate
- Types of Unemployment
- Costs of Unemployment
- Useful Web Resources
|
|
Chapter Six: Lecture Notes -- Unemployment
|
|
The unemployment rate is the percentage of the labor force that is unemployed. |
Unemployment is perhaps the most serious of all economic problems. If someone is unemployed, her ability to provide for herself and her family are compromised. Martin Luther King, Jr. argued that government has a fundamental responsibility to provide a job for all its citizens. Though the United States has yet to achieve that goal, the government and the Federal Reserve do a number of things to reduce unemployment. Since the Great Depression, the federal government has assumed political responsibility for the state of the economy, and it has put in place a number of programs that attempt to stabilize the economy during a downturn to mitigate the effects of unemployment. We discuss these policies in detail in Chapter 12, Fiscal Policy & Supply-Side Economics.
Unemployment in the U.S. follows a counter-cyclical pattern, rising when the economy's GDP is declining, and falling when the economy recovers. The unemployment rate is a lagging indicator. The rate tends to rise only after the recession has begun, and it peaks well after the recession is officially over. The 2001 U.S. recession, for example, ended in November of 2001, but the unemployment rate peaked at 6.3 percent in June, 2003, more than a year after the end of the recession.
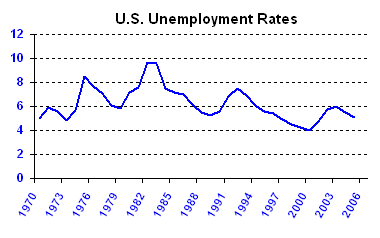
Despite some misperceptions, unemployment in the United States is not getting constantly worse. In fact, unemployment rates were relatively low in the 1990s, reaching a low of 3.8 percent in April 2000. Despite the recession begun in March 2001, the unemployment rate was just 6 percent in 2003, and it dropped to 5.1 percent in 2005 as the economy recovered. As we will see, part of the reason for the relatively low unemployment rates following the 2001 recession was the massive fiscal and monetary policy pursued by the goverment and the Federal Reserve, respectively. The figure titled "U.S. Unemployment Rates" plots unemployment rates from 1970 through 2006. Observe the counter-cyclical pattern in the series.
Each month, the Bureau of Labor Statistics (BLS) reports the unemployment rate for the United States economy. In July 2006, for example, the unemployment rate was 4.8 percent. This means that 4.8 percent of the labor force was unsuccessfully looking for work. In order to fully understand what this statistic means, we have to understand how it is calculated.
Measuring UnemploymentThe Bureau of Labor Statistics has a set of frequently asked questions in which they explain in more detail how to measure unemployment. This site describes the statistical techniques and economic assumptions used in calculating the national unemployment figures. We summarize the main steps below.Each month the Bureau of Labor Statistics polls over 50,000 households either in person or by phone. The respondents of the survey are classified into one of three categories: unemployed, employed, or not in the labor force. Those are the only three options. The labor force consists of all those employed and unemployed. To be counted as employed, a person must have worked at a job for pay or profit during the survey week (the week that contains the 12th of the month), or she must have worked without pay for more than 15 hours for a family business. Persons are classified as unemployed if they do not have a job, have actively looked for work in the prior four weeks, and are currently available for work. If a person has no job and has not actively looked for work in the prior four weeks or is currently unavailable for work except for a temporary illness, then he is classified as not in the labor force. All those who work for less than 15 hours per week in a family business but receive no pay are also classified as not in the labor force. The unemployment rate is the percentage of the labor force that is unemployed, or

The Federal Reserve Bank of St. Louis has a record going back to 1948 of historical U.S. unemployment rates. Calculating Unemployment Rates: An Example
Table 1 provides labor force information from a survey of 800 individuals regarding their employment status. To calculate the unemployment rate, we must determine the number unemployed and the number in the labor force. There are 50 who claim that they would want to work, but 22 of them have not actively sought work in the prior four weeks. The BLS, therefore, counts only 28 (50 - 22) of them as officially unemployed.
There are two approaches to calculate the labor force. First, we can add the employed (420) to the officially unemployed (28), for a total of 448. Second, we can subtract from the sample population (800) all those not in the labor force: the retired (180), students (150), and those "unofficially" unemployed but not actively looking for a job (22). This approach also yields a labor force of 448. The unemployment rate is then 28/448 * 100 = 6.25%.
|
|||||||||||||||
|
The unemployment survey may give misleading information about the true unemployment situation. |
Criticisms of the Unemployment RateDespite the care taken in calculating unemployment, there are three common criticisms of the survey that are said to give misleading information about the true unemployment situation. These criticisms are:
The BLS has a response to each of these criticisms. First, why should it count as unemployed those that do not take an initiative to find a job? One cannot find a job without looking. Second, the unemployment rate is not intended to capture information about part-time employment. Other reports can provide information about this aspect of the labor market. Third, any survey is only as good as the honesty of those who answer it. Given the large sample size and the detailed questions asked of participants, the unemployment rate remains a reliable gauge of economic performance in the United States. Moreover, as long as the survey is carried out consistently each month, the variation in unemployment rates through time still gives meaningful information about the relative performance of the economy from month to month.
|
|
Unemployment consists of frictional, structural, and cyclical unemployment. The natural rate of unemployment is estimated to be between 5 percent and 5.5 percent. |
Types of UnemploymentAn important goal of stabilization policy is a low unemployment rate. How low of a rate should the economy have? The ideal unemployment rate is far from zero because a modest amount of unemployment occurs naturally in any dynamic economy. Economists classify unemployment into three broad categories listed below.
Frictional and structural unemployment are unavoidable in a dynamic economy. These two combined are called the natural rate of unemployment, or the full-employment rate of unemployment. There is nothing that macroeconomic policy can do to reduce or eliminate frictional and structural unemployment. Many economists estimate the U.S. natural rate of unemployment to be between 5 percent and 5.5 percent. Unemployment rates below this level may lead to an increase in the inflation rate. (See Chapter 16, The Phillips Curve.) Policy makers are reluctant, therefore, to push the unemployment rate much below this natural rate.
|
|
The economic cost of unemployment is the difference between potential output and actual output. |
Costs of UnemploymentThere are many social and psychological costs of unemployment that range from poverty to depression. These costs are real and important but difficult to quantify. From an economic point of view, the measurable cost of unemployment is the lost output and, hence, lost consumption. What would the economy have produced if labor were fully employed? The economic costs of unemployment are the goods and services that might have been produced and consumed that are lost forever.To measure these costs, we take the difference between potential and actual output.

where potential output is the level of GDP the economy would attain if all resources were fully employed. During recessions when unemployment is high, some labor is sitting idle and that lost work can not be made up. The higher the rate of unemployment, the higher the costs of unemployment.
|
Useful Web Resources
|
|
|
Copyright © 1996-2006 OnlineTexts.com - All Rights Reserved |