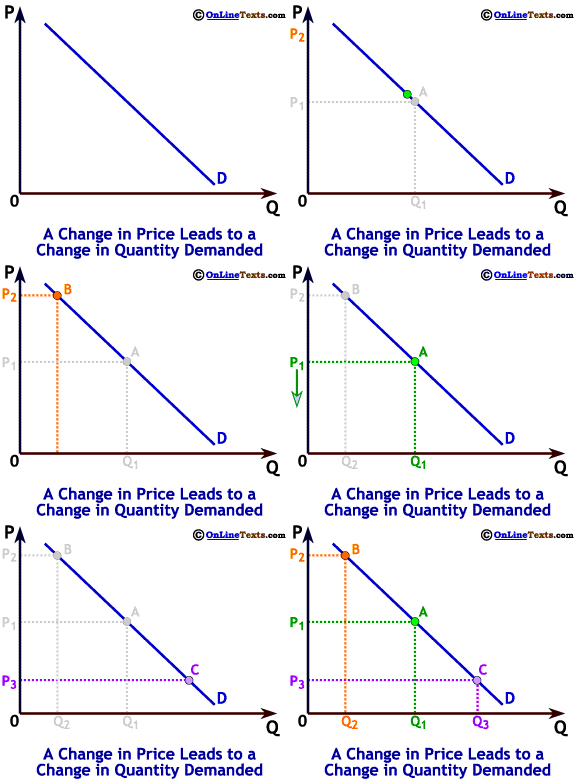
On the graph to the right, we illustrate the effect of a price change on desired quantity demanded. In this example, we use variables rather than specific numerical values for prices and quantities.
We draw a horizontal line from the vertical axis at price P1 until it intersects the demand curve, D, at point A. We draw a vertical line down from the demand curve to the horizontal axis to find that Q1 is the quantity demanded at price P1. When the price increases to P2, we move up the demand curve to point B; quantity demanded falls to Q2. When price falls to P3, we move down the demand curve to point C, where desired quantity demanded is Q3.
It might seem like a subtle difference, but we must be careful to distinguish between a change in quantity demanded and a change in demand. A change in quantity demanded means a movement along a particular demand curve due to a price change. A change in demand means the entire demand relationship has changed. A change in demand is illustrated graphically by a shift in position, and possibly of slope and curvature as well, of the entire demand curve.

