

2 The "origin" refers to the intersection of the coordinate axes in the Cartesian coordinate system. The value of both variables is zero at the origin.
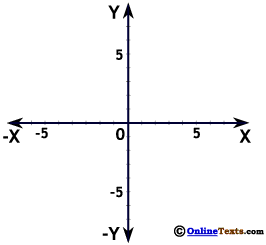
The axes to the right should look somewhat familiar, though they may recall less than pleasant memories. This is the Cartesian coordinate system, used to illustrate relationships between two variables.
Values of X are measured along the horizontal axis and are positive and increasing as we move to the right of the origin2 (center) and are negative and decreasing as we move to the left. Values of Y are measured along the vertical axis and positive and increasing as we move up from the origin and negative and decreasing as we move downward from the origin. At the center both X and Y are equal to zero. We do not have to use X and Y as our variable names, they can be anything. In economics they are often price, P, and quantity, Q.
To the right we plot the point where X = 5 and Y = 7. We move to the right of the point where X = 0 by 5 units. Then we move up from the point where Y = 0 by seven units. We then find where a vertical line from the point where X = 5 and a horizontal line from the point where Y = 7 intersect. This is the point where X = 5 and Y = 7.
2 The "origin" refers to the intersection of the coordinate axes in the Cartesian coordinate system. The value of both variables is zero at the origin.