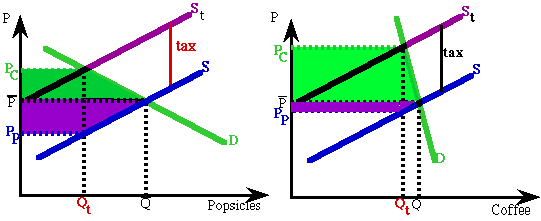
The graph above shows the lost
consumers' and producers' surplus in the two markets.
Consumers' surplus in green, producers' in purple. Consumers lose the
greater suplus in the coffee market, because their demand is more inelastic, less
flexible. Because demand for popsicles is more elastic, consumers substitue
away from popsicles easily and thus producers are able to pass on less of the
tax, causing producers to lose the greater surplus in the popsicle market.
