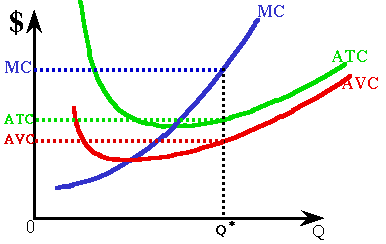
The graph to the left shows typical short-run cost curves. MC, ATC, and AVC for output Q* are shown on the left axis.