
8 Don't worry if this second paragraph doesn't make much sense right now, though if it still doesn't make sense after you've covered Chapter 4, feel free to worry.
Click Here if you don't see topics listed to the left and below.

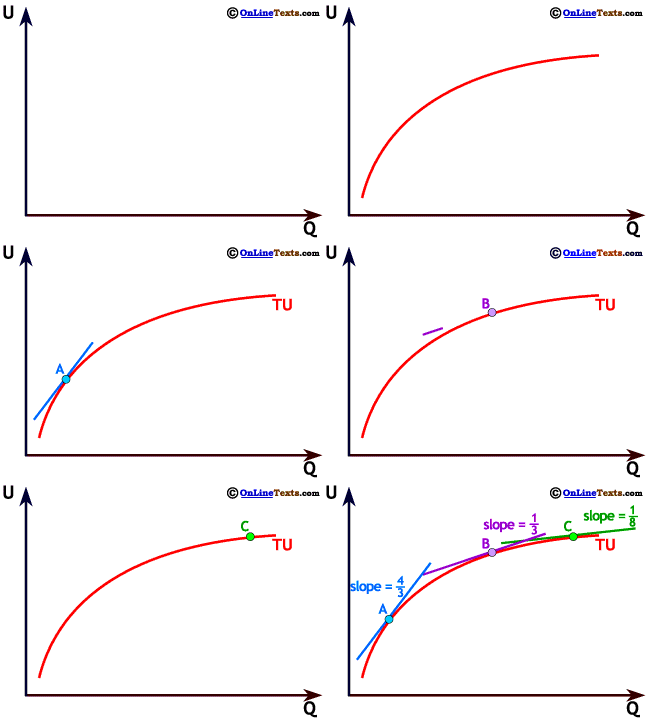
To the right is a graph of a positive, nonlinear relationship that is increasing at a decreasing rate. We show the slope at three different points. As Q increases, TU increases, but it should be clear that the rate of increase is getting smaller the greater the value of Q (the farther to the right on the graph). The slope of the graph at any given point is the rate of increase in TU. At point A, where Q is small, the curve is steep with a slope of 4/3. At point B the curve is becoming flatter and the slope is 1/3, while at point C the curve is flatter still with a slope of only 1/8.
This particular graph is a graph of Total Utility and, at each point, the slope of the curve can be interpreted as Marginal Utility, so that would mean Marginal Utility is decreasing as Q increases.8


8 Don't worry if this second paragraph doesn't make much sense right now, though if it still doesn't make sense after you've covered Chapter 4, feel free to worry.
Click Here if you don't see topics listed to the left and below.