
Click Here if you don't see topics listed to the left and below.

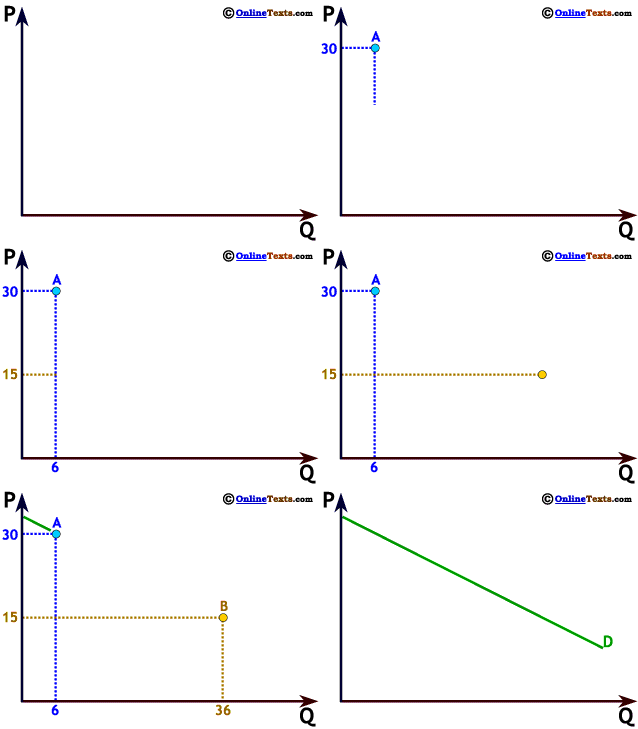
The graph to the right shows a negative linear relationship, or an inverse linear relationship. It is termed negative or inverse because larger values of P are associated with smaller values of Q; another way of stating this is that smaller values of P are associated with larger values of Q. We illustrate this with two values on the graph to the right. When P = 30 the value of Q is only 6, but when P falls to 15 Q increases to 36, so the relationship is an inverse or negative relationship. As before, it's called a linear relationship because its graph is a straight line.


Click Here if you don't see topics listed to the left and below.