
5 It's more precise to write "desired quantity demanded," but it is often shortened to "quantity demanded."
Click Here if you don't see topics listed to the left and below.

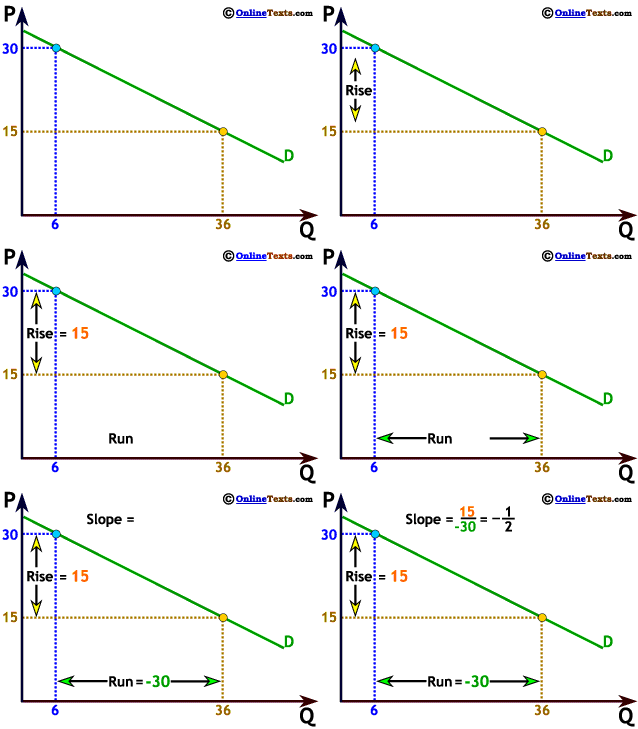
The curve to the right is a demand curve, which tells us the quantity demanded5 for any given price. As we noted earlier, this is a negative or inverse relationship, which is why the curve slopes downward to the right, and because the relationship is linear, the slope is the same everywhere.
As we saw earlier, we can compute slope by the change in the variable on the vertical axis divided by the change in the variable on the horizontal axis, or the "rise over the run." On our graph to the right, when P increases from 15 to 30, Q decreases from 36 to 6. The "rise" = 15, while the "run" = -30 so the slope is 15 ÷ -30 = - 1/2.
This constant, negative slope tells us that quantity demanded will fall by 2 units, for every 1 unit increase in price. So, if price is measured in dollars, an increase in price of 1 dollar will cause quantity demanded to fall by 2 dollars. This particular relationship can be expressed simply with the equation: Q = 66 - 2P.


5 It's more precise to write "desired quantity demanded," but it is often shortened to "quantity demanded."
Click Here if you don't see topics listed to the left and below.