
Click Here if you don't see topics listed to the left and below.

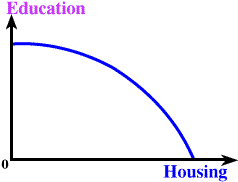
Let's move to a different example. Consider the graph to the right, showing choices that face some society. This society can spend its resources on two things, education and housing.
It seems reasonable to suppose that this PPF also has the same
bowed out shape, indicating that the OC of education in terms of housing varies. This is because some resources are better used for education, and others for housing. For example, some people are better carpenters than teachers,
and vice versa.


Click Here if you don't see topics listed to the left and below.